7.1 Jitter and Count Plots
In Section 6.1, we have seen that scatterplot is a useful tool to visualization the relationship between two continuous variables. You may be wondering what will happen if we use it on two discrete variables.
7.1.1 Overplotting
As an example, let’s look at the gm2004 dataset, and generate a scatterplot between continent and HDI_category.
library(r02pro)
library(tidyverse)
ggplot(data = remove_missing(gm2004, vars = c("continent", "HDI_category"))) +
  geom_point(mapping = aes(x = continent,
                           y = HDI_category)) #overplotting
From the plot, you may immediately realize that there are many possible overlapping data points. Indeed, there will be at most 20 distinct points on the plot since there are 5 continents and 4 different HDI categories. This phenomenon is called overplotting. Overplotting is not desirable since it hides useful information about the joint distribution. For example, we don’t know which value pairs out of the 20 possibilities appear more frequently in the data.
To solve the overplotting issues, we introduce two solutions, namely jittering and count plots.
7.1.2 Jittering
The first method for solving the overplotting issue is to add a small random perturbation to all datapoints, i.e., jittering. You can use the geom_jitter() function which works by first perturb the data points and then generate a scatterplot.
ggplot(data = remove_missing(gm2004,
                             vars = c("continent", "HDI_category"))) +
  geom_jitter(mapping = aes(x = continent,
                            y = HDI_category))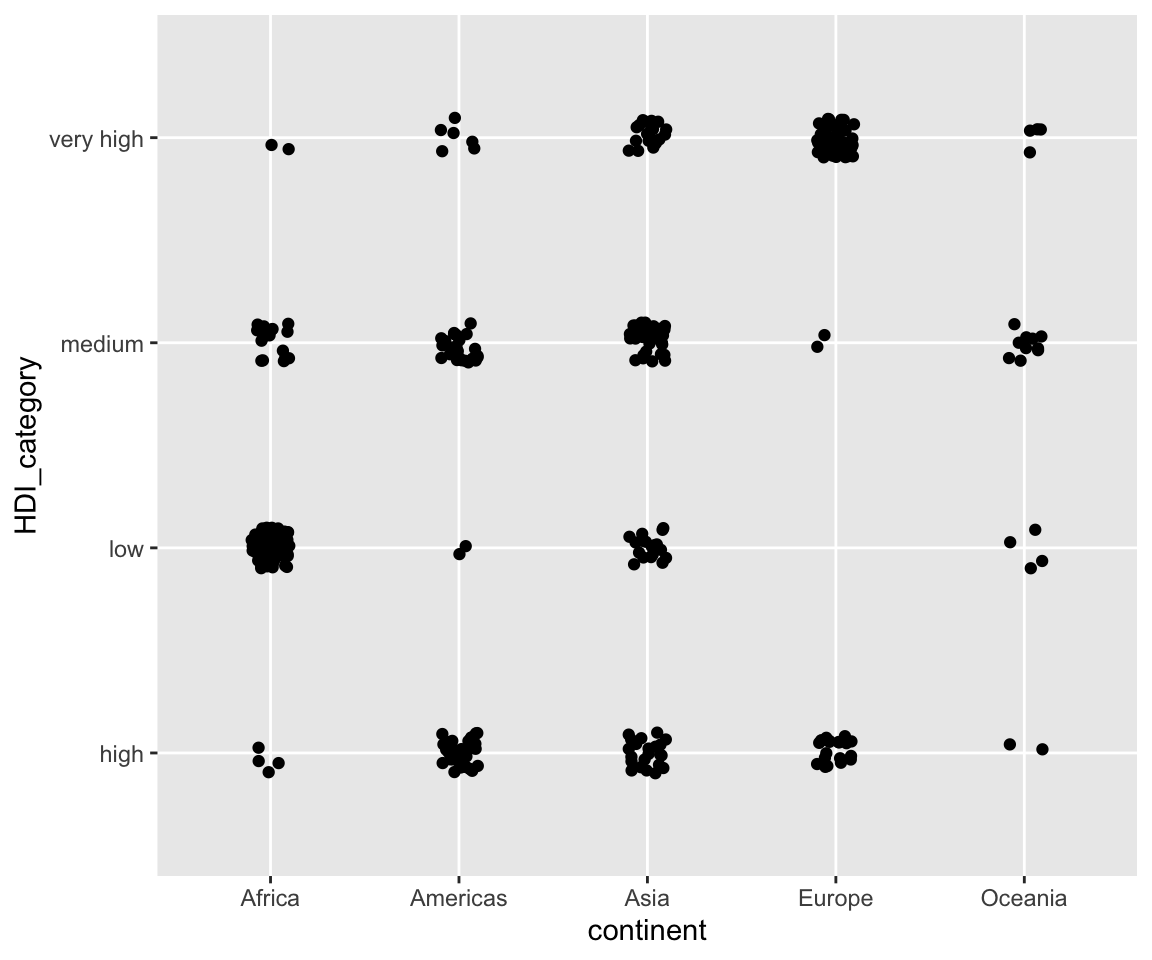
For the jittered plot, we can clearly see which pair of continent and HDI_category have more observations. By default, the perturbation will be performed both vertically and horizontally with the same amount of 40% of the resolution of the data. To customize the amount of jittering, you can specify the arguments width as the amount of horizontal jittering and height as the amount of vertical jittering in the unit of the resolution of the data. To turn off the horizontal jittering, you can specify width = 0.
ggplot(data = remove_missing(gm2004,
vars = c("continent", "HDI_category"))) +
geom_jitter(mapping = aes(x = continent,
y = HDI_category),
width = 0.1,
height = 0.1)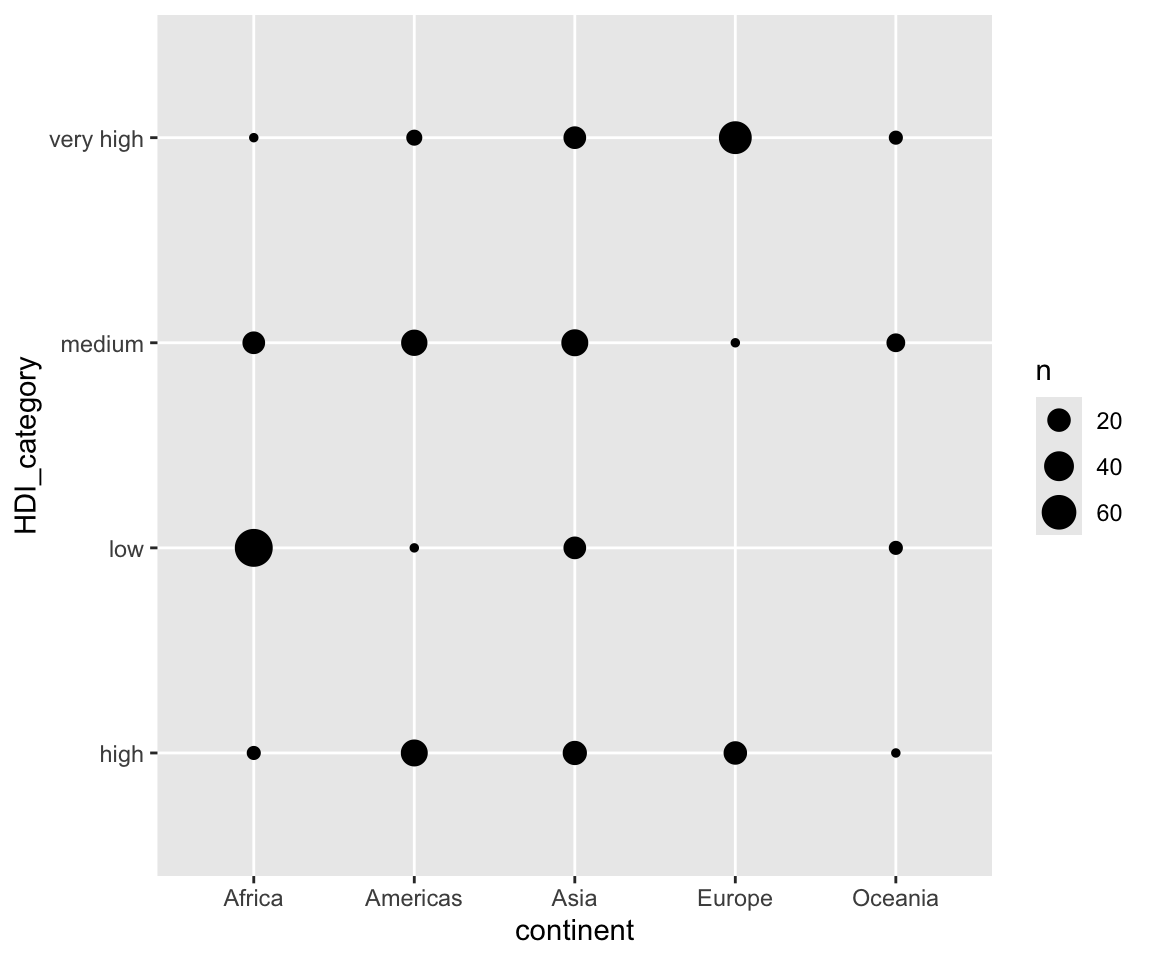 Now, we can see that Africa has a large number of countries with low HDI category while Europe has almost all countries in the high or very high HDI category.
7.1.3 Counts Plots
When we want to visualize the distribution of a pair of discrete variables, another method to solve the overplotting issue is the count plot, which uses circles of different sizes to represent the frequency of each value pair. You can use the function geom_count() to generate a count plot.
ggplot(data = remove_missing(gm2004,
                             vars = c("continent", "HDI_category"))) +
  geom_count(mapping = aes(x = continent,
                            y = HDI_category),
              width = 0.1,
              height = 0.1)
From this plot, you can clearly tell the frequency of each value pair by the legend showing the relationship between the size of the circle and the count.
