4.6 Global and Local Aesthetic Mappings
In Section 4.5, you learned how to combine the scatterplot and smoothline fit into a single plot by using two geoms. Let’s first review the code.
library(r02pro)
library(tidyverse)
ggplot(data = sahp) +
  geom_point(mapping = aes(x = liv_area, y = sale_price)) +
  geom_smooth(mapping = aes(x = liv_area, y = sale_price))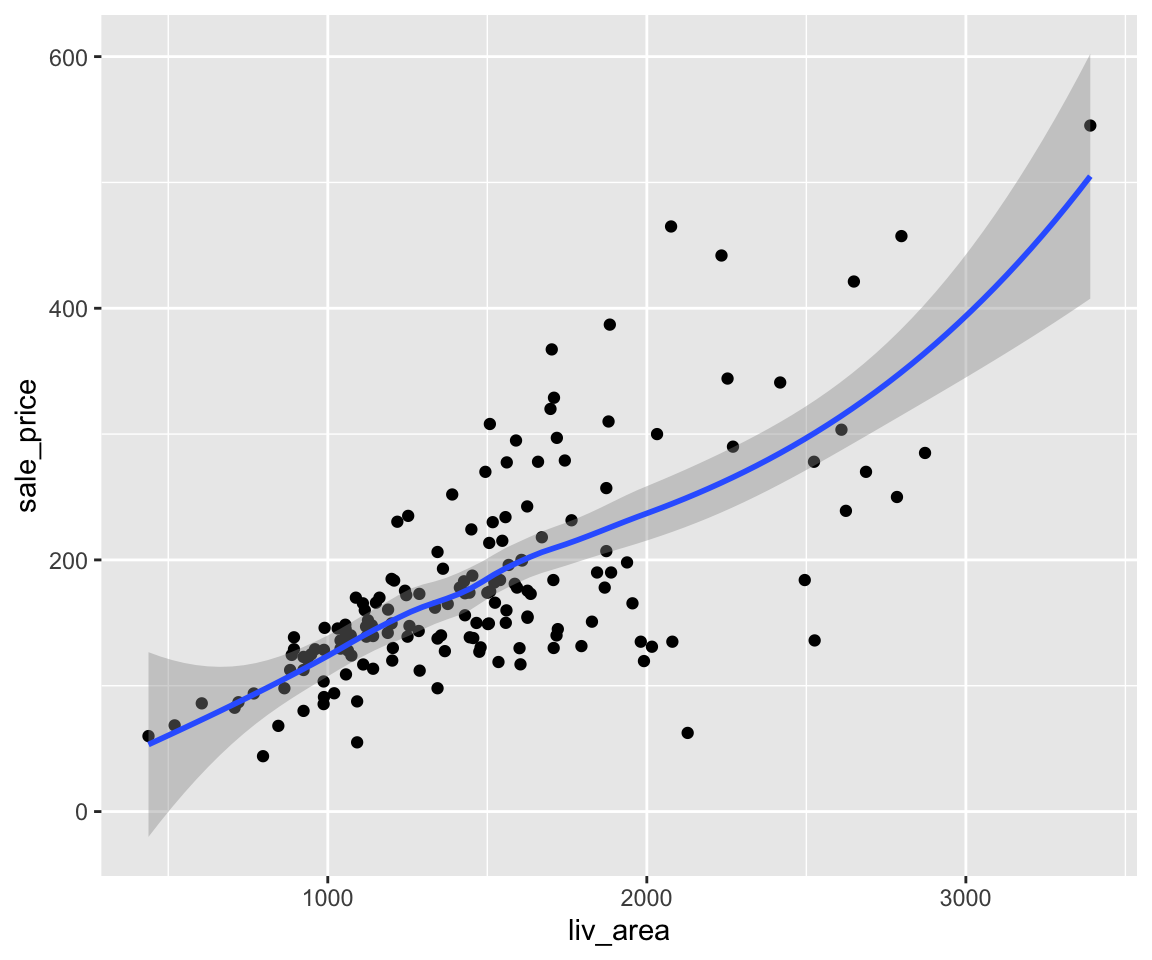
You may notice that the arguments inside geom_point() and geom_smooth() are identical. Now, thinking about if we want to generate another plot by replacing the liv_area with lot_area (the size of lot area), both instances of liv_area need to be changed to lot_area, which is a bit cumbersome. It turns out we can use the so-called global mapping to simplify the code. Correspondingly, we call a mapping inside a specific geom local mapping.
To use the global mapping, we move the mapping argument from the geoms into the ggplot() function.
ggplot(data = sahp,
       mapping = aes(x = liv_area, y = sale_price)) +
  geom_point() +
  geom_smooth()
We can also map variables to aesthetics in the global mapping. The global aesthetic mapping will be inherited in all geoms used.
ggplot(data = sahp,
       mapping = aes(x = lot_area,
                     y = sale_price,
                     color = kit_qual)) +
  geom_point() +
  geom_smooth()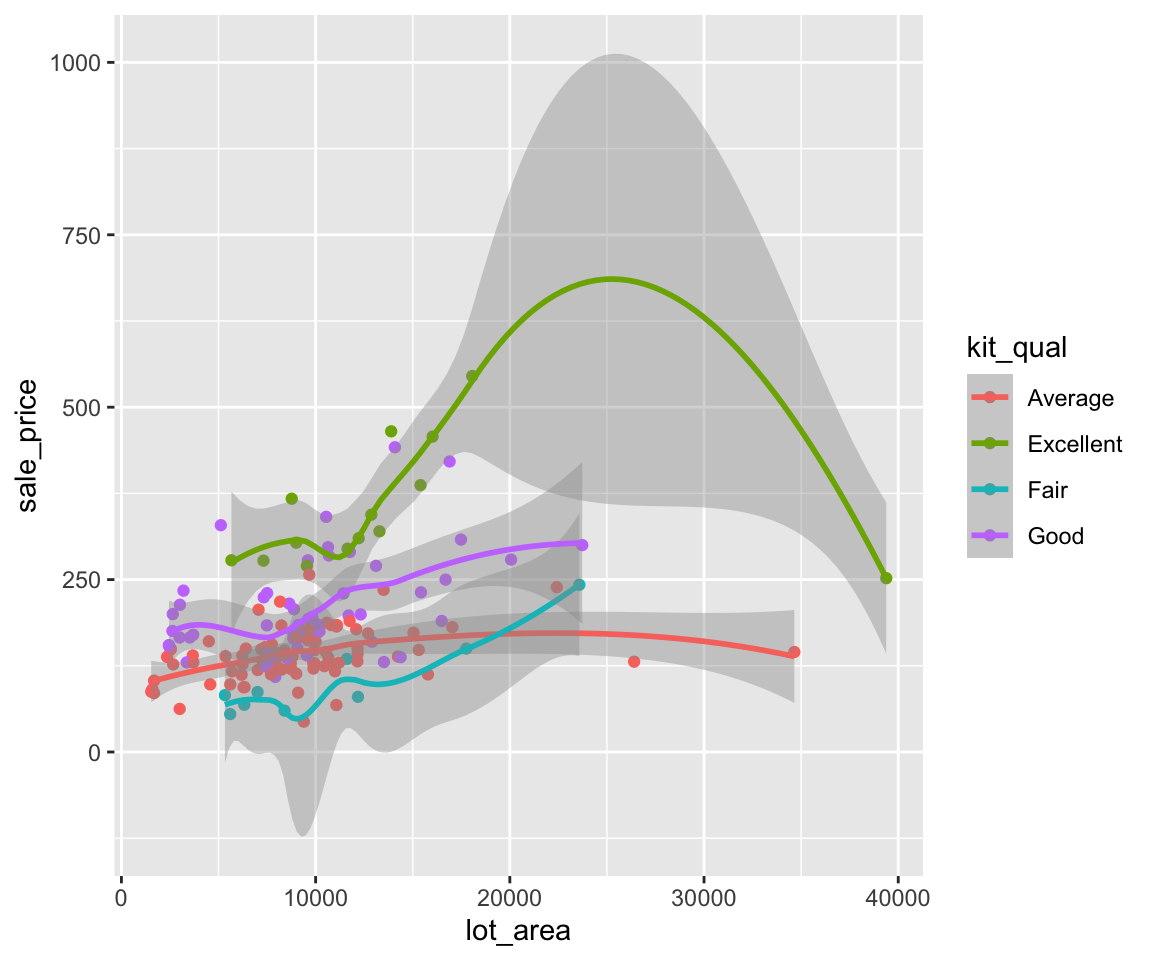
Clearly, the use of global mapping greatly simplify our code as we would need to repeat the same mapping argument in both geoms.
In addition to using the same mapping in each geom as the global mapping, we can also extend or overwrite the global mapping in each geom.
4.6.1 Extend Global Aesthetic Mappings
In addition to the global aesthetic mappings, you can add additional mappings in each geom.
ggplot(data = sahp,
       mapping = aes(x = lot_area,
                     y = sale_price,
                     color = kit_qual)) +
  geom_point(mapping = aes(shape = gar_car > 1)) +
  geom_smooth(mapping = aes(linetype = kit_qual))
Here, both geom_point() and geom_smooth() will first inherit the global mappings, then add the shape and linetype aesthetics, respectively. As you can see from the legend, there are some missing values for the variable gar_car. If you want to remove the observations that has a missing gar_car, you can use the function remove_missing().
ggplot(data = remove_missing(sahp, vars = "gar_car"),
       mapping = aes(x = lot_area,
                     y = sale_price,
                     color = kit_qual)) +
  geom_point(mapping = aes(shape = gar_car > 1)) +
  geom_smooth(mapping = aes(linetype = kit_qual))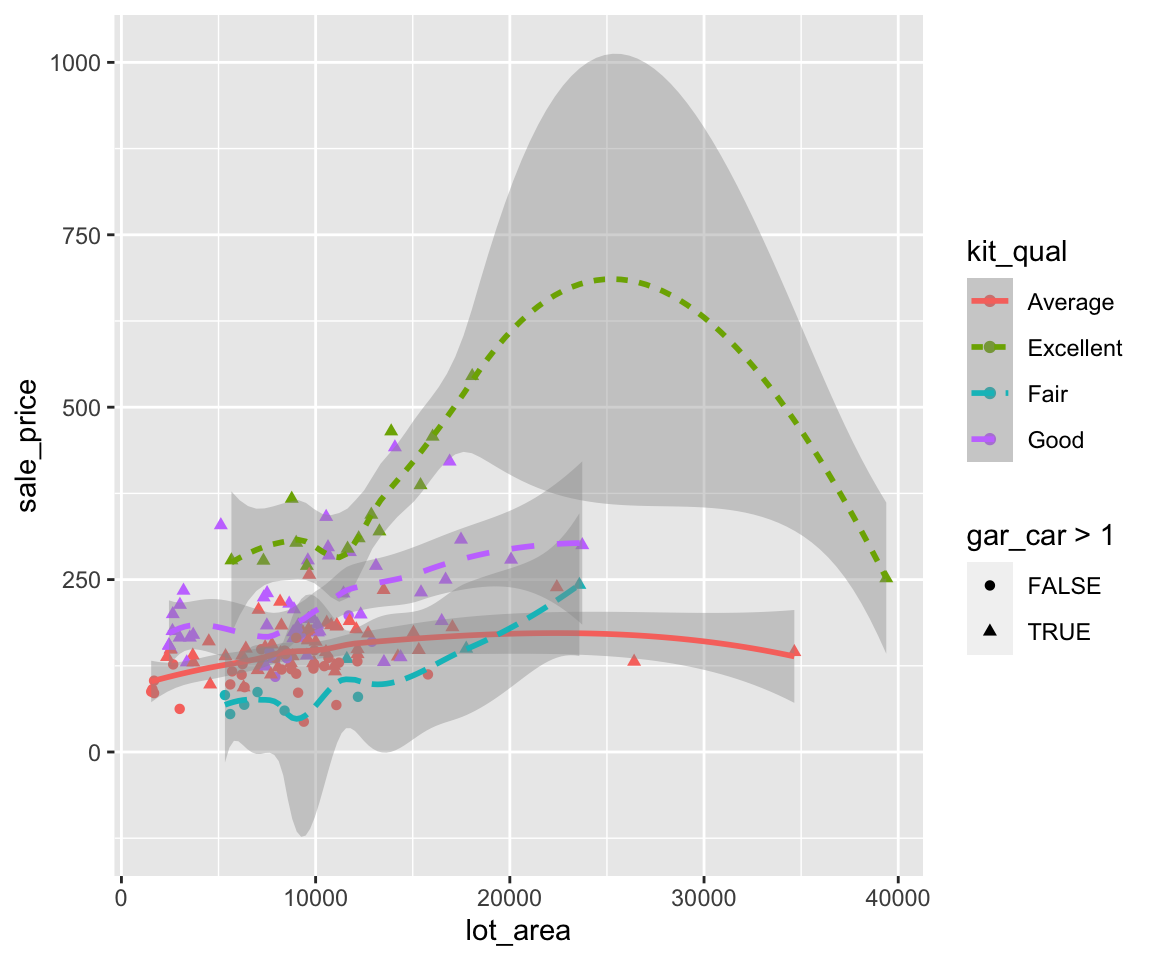
In the remove_missing() function, we use the argument vars = "gar_car" to indicate that only the observations with a missing gar_car are removed. Note that you may be tempting to use the function na.omit() on the data sahp. However, it is not recommended as the function will remove all observations whenever there is missing value for one variable, even if the variable is not used in the visualization process.
4.6.2 Overwrite Global Aesthetic Mappings
When you add the same aesthetic mapping in the local geom as one of the global mappings, the corresponding global aesthetic mapping will be overwritten.
ggplot(data = sahp,
       mapping = aes(x = lot_area,
                     y = sale_price,
                     color = kit_qual)) +
  geom_point(mapping = aes(color = gar_car > 1)) +
  geom_smooth(mapping = aes(color = gar_car > 1))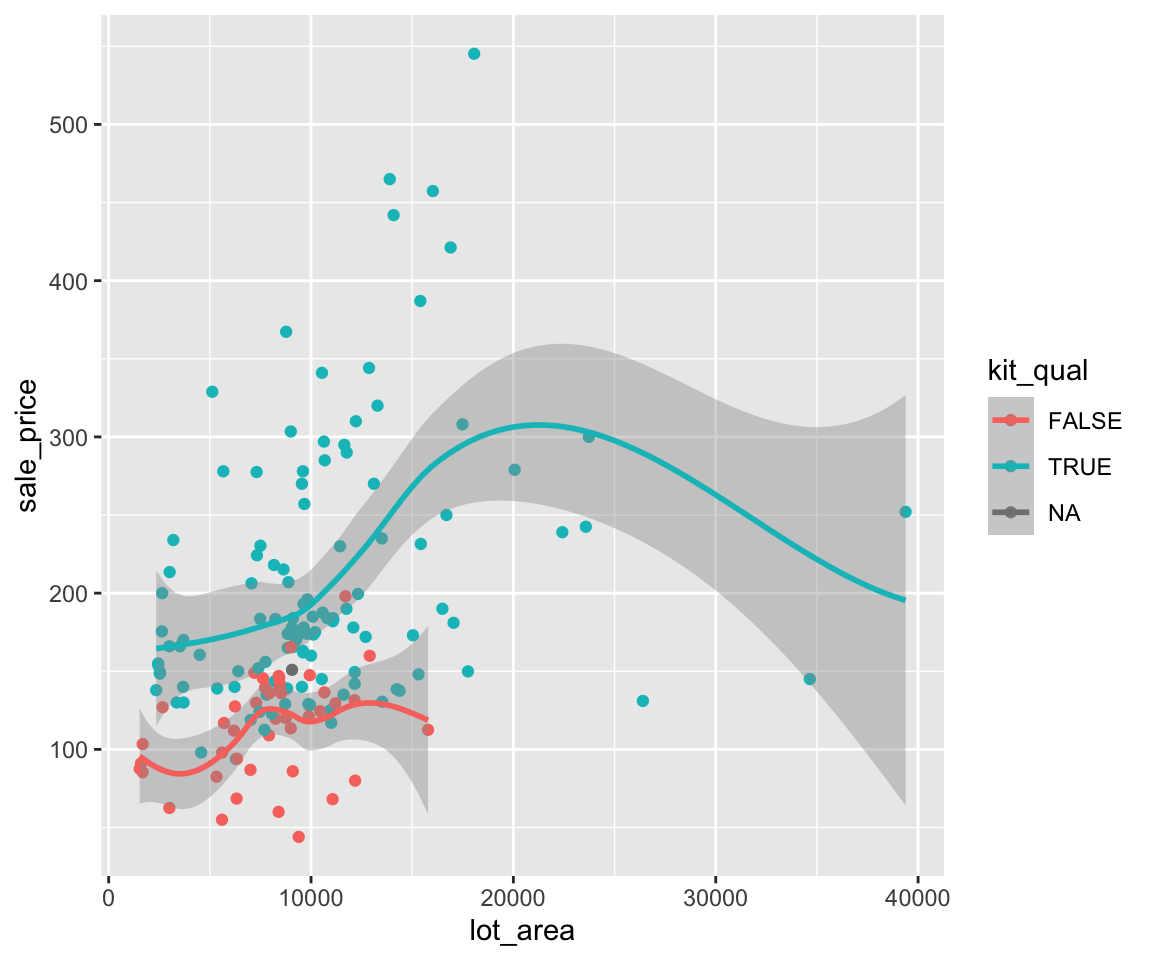
Here, you can see that the color aesthetic mapping corresponding to the logical variable color = gar_car > 1.
It is worth to note the difference between global aesthetics (introduced in Section 4.3) and the global aesthetic mappings introduced here. The global aesthetics set the aesthetic for all points/lines on the graph for a single geom while the global aesthetic mapping represents the mapping which will be passed to all geoms. Although we can set global aesthetic mappings, it is impossible to set “global” global aesthetics. Let’s try to set all points and lines to be red.
ggplot(data = sahp,
       mapping = aes(x = lot_area, y = sale_price),
       color = "red") +
  geom_point() +
  geom_smooth()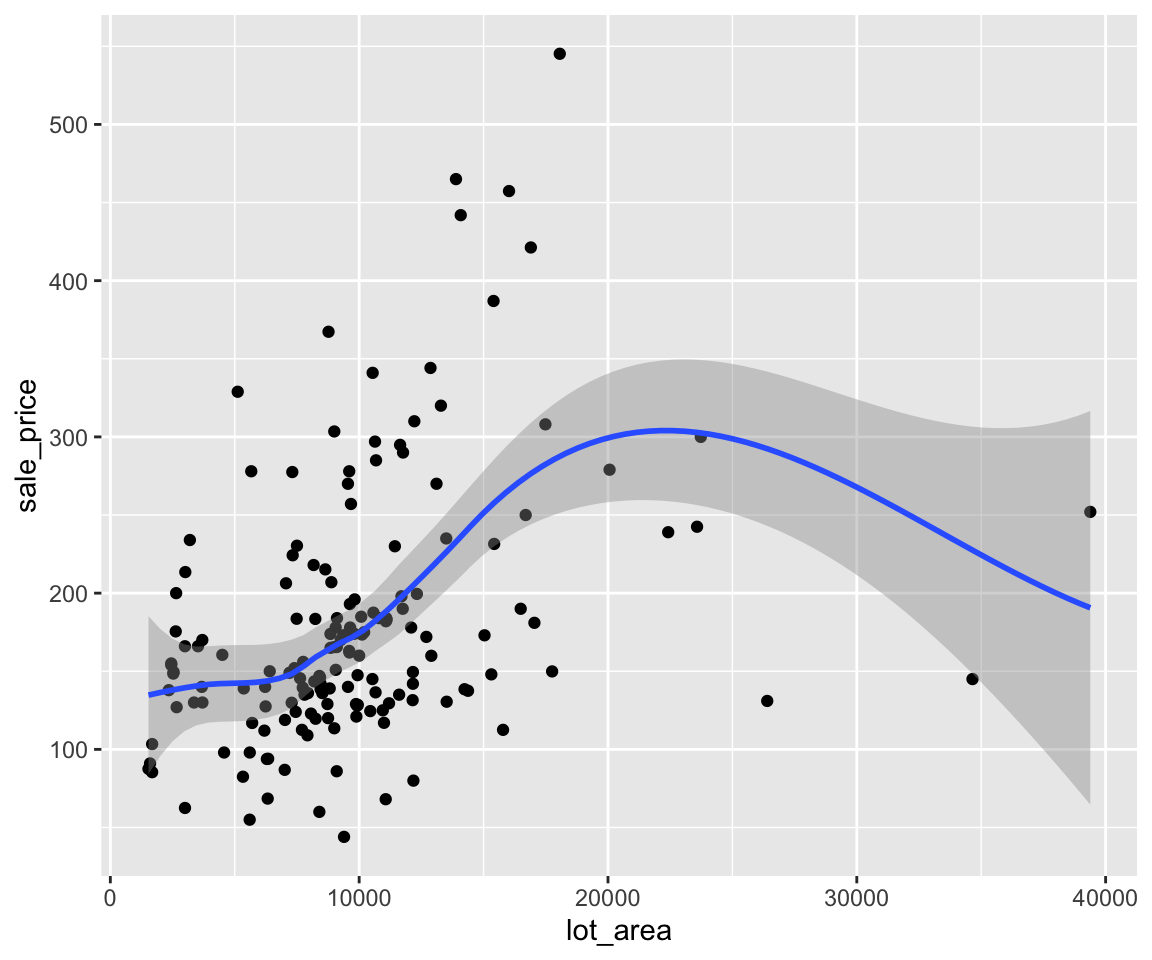
As you can see the color = "red" argument was ignored during the plotting process. To achieve this, you need to use color = "red" as global aesthetics for both geoms as below.
ggplot(data = sahp,
       mapping = aes(x = lot_area, y = sale_price)) +
  geom_point(color = "red") +
  geom_smooth(color = "red")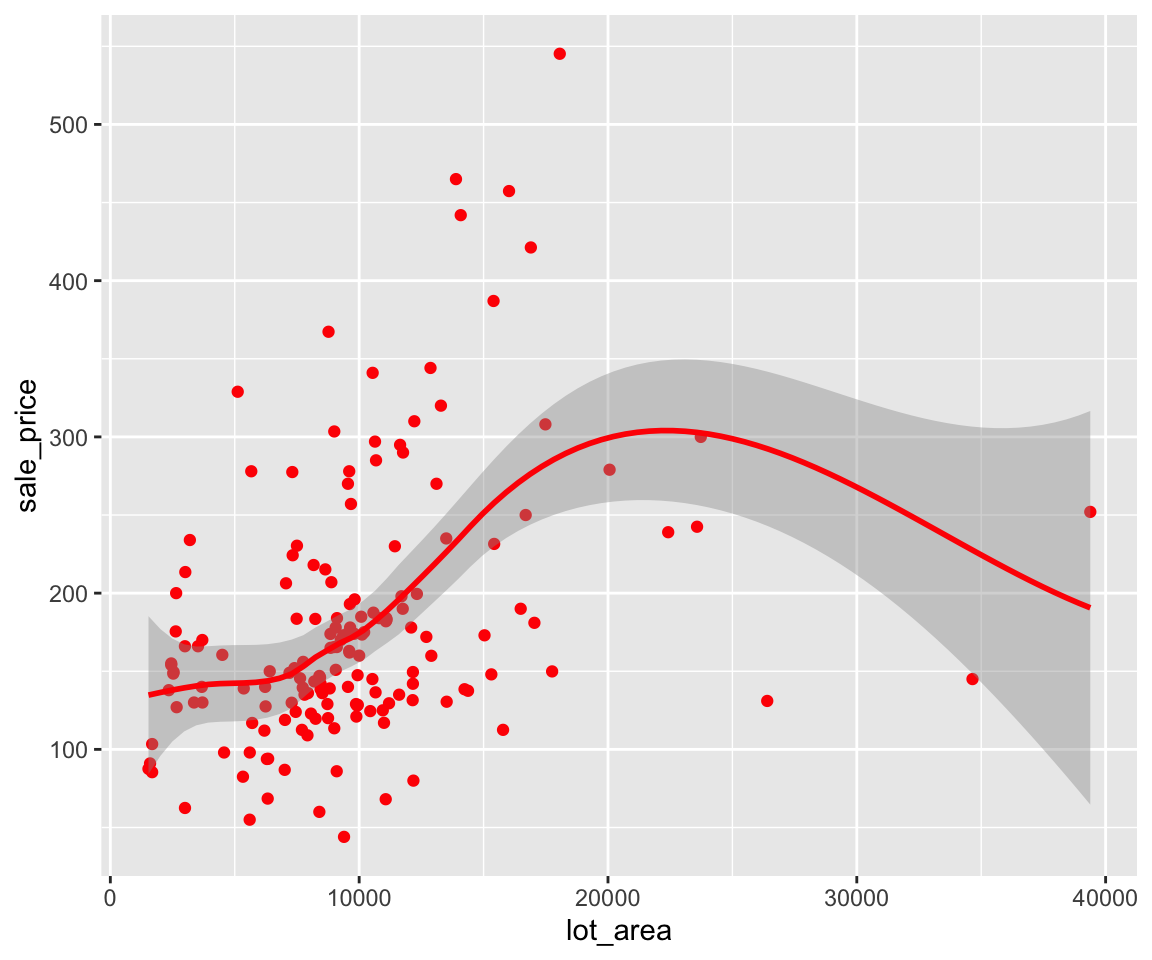
4.6.3 Mix
As you may have expected, it is straightforward to mix global aesthetic mappings, local aesthetic mappings, and global aesthetics for each geom.
ggplot(data = remove_missing(sahp, vars = "kit_qual"),
       mapping = aes(x = liv_area,
                     y = sale_price,
                     color = kit_qual)) +
  geom_point(mapping = aes(shape = house_style == "2Story"),
             size = 2) +
  geom_smooth(linetype = 2, se = FALSE)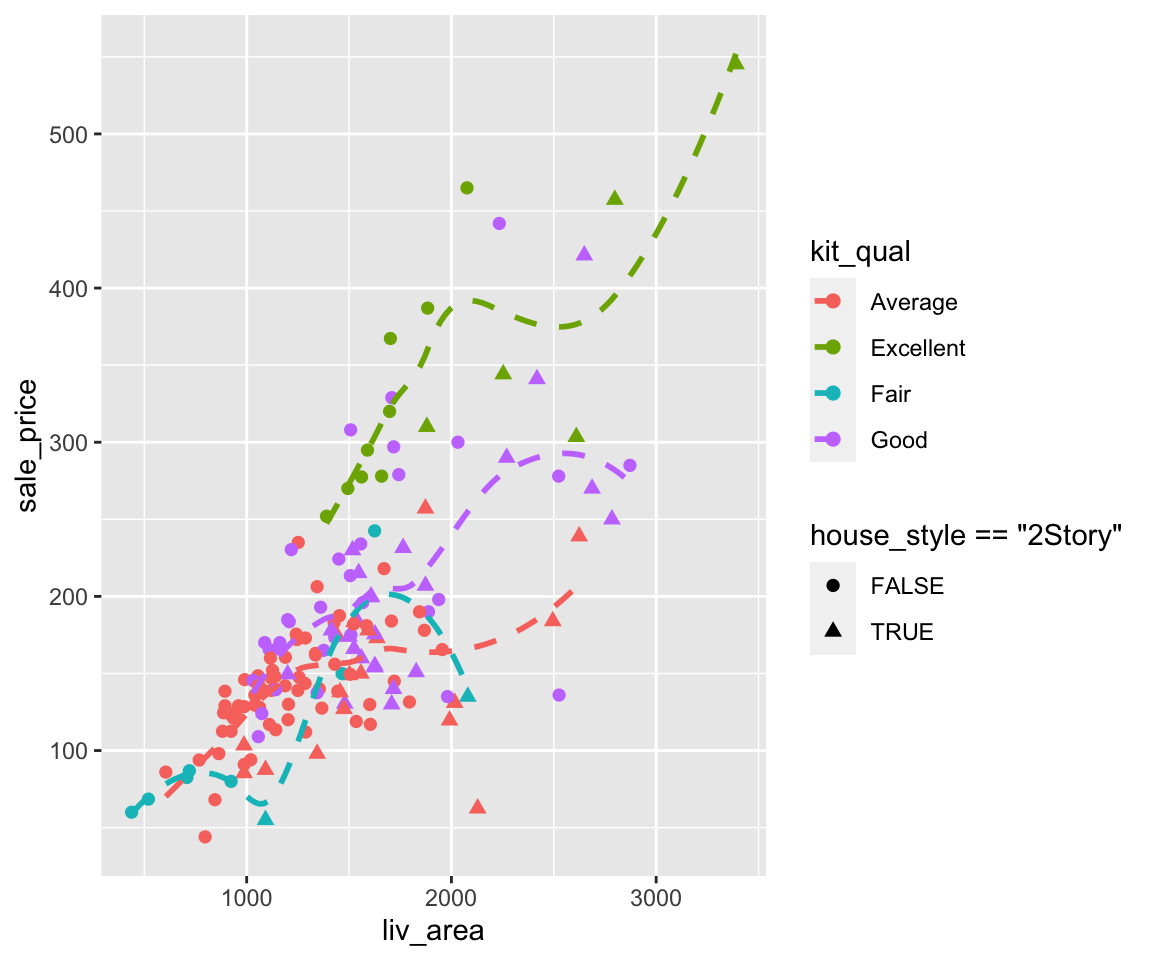
Note that we again use the remove_missing() function to remove observations with missing kit_qual.
4.6.4 Exercises
Using the sahp dataset with the ggplot2 package, and using global and local mappings to answer the following questions.
- Create a plot of
liv_area(on the x-axis) andsale_price(on the y-axis) that contains both the scatterplot and the smoothline fit. - In the plot from Q1, using different colors for both the scatterplot and the smoothline fit to distinguish whether the house has more than 3 bedrooms and make all points to be size 2.
- If you run the following code
ggplot(data = sahp, mapping = aes(x = liv_area, y = sale_price), color = "green") + geom_point() + geom_smooth(), do you think all the points and the smoothline will be green? If not, explain the reason and make them green. - If you run
ggplot(data = sahp, mapping = aes(x = liv_area, y = sale_price, color = house_style)) + geom_point(mapping = aes(color = bedroom > 3)) + geom_smooth(mapping = aes(color = bedroom > 3)), explain why you only see two colors in the plot?