6.3 Pipe: Combining Multiple Operations
We have now learned how to filter observations according to a set of conditions (Section 6.1) and how to rearrange observations according to a set of variables (Section 6.2). In practical applications, we usually need to apply multiple operations sequentially on a given data.
Let’s consider the ahp dataset again. Say we want to first find the houses that were sold in Jan 2009 and with over all condition 5. Then, arrange the houses from the oldest to the newest. Finally, create a scatterplot on the sale_price vs. liv_area.
library(r02pro)
library(tidyverse)
jan09 <- filter(ahp, yr_sold == 2009, mo_sold == 1, oa_cond == 5) #filtering
jan09_yr <- arrange(jan09, yr_built)                              #find the oldest houses
ggplot(jan09_yr, mapping = aes(x = liv_area, y = sale_price)) + geom_point()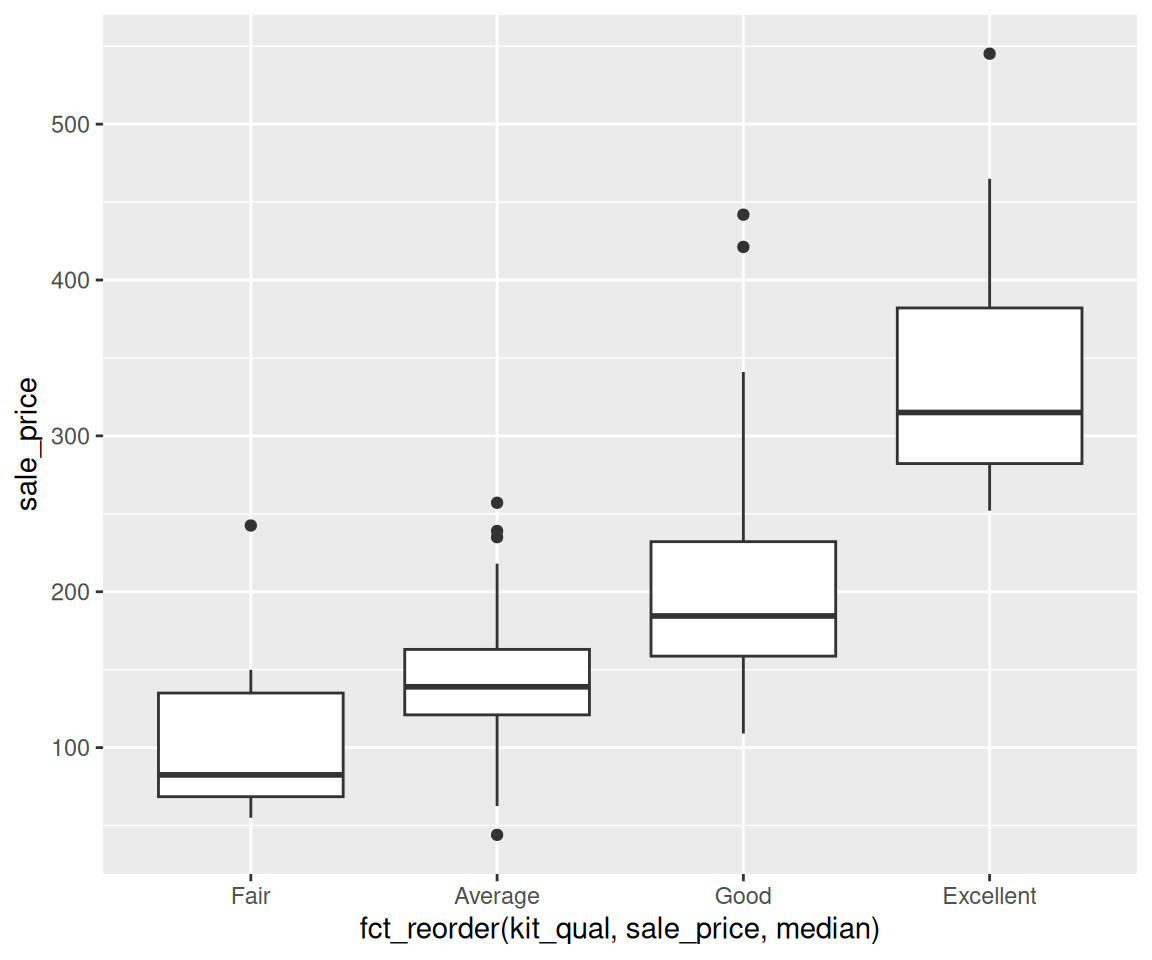
You may notice that we created two intermediate objects named jan09 and jan09_yr which may be unnecessary. Let’s say what happens to the code if we are not allowed to define such intermediate objects.
ggplot(arrange(filter(ahp, yr_sold == 2009, mo_sold == 1, oa_cond == 5), yr_built),
       mapping = aes(x = liv_area, y = sale_price)) + geom_point()
We hope you agree that while the code gets the work done, it is not pretty. To make the code more streamlined and intuitive, you can take advantage of the pipe operator %>% in the dplyr package. Let’s take a look at the code using pipes before going to the details.
ahp %>%
  filter(yr_sold == 2009, mo_sold == 1, oa_cond == 5) %>%
  arrange(yr_built) %>%
  ggplot(mapping = aes(x = liv_area, y = sale_price)) +
  geom_point()
We hope you agree this code looks more intuitive than the previous version. The working mechanism of %>% is as follows. When you use data %>% some_function(argA, argB), this is equivalent to some_function(data, argA, argB). As a result, you can use multiple %>% operators in a row, if the first function provides an output which is the input data of the second function, etc.