6.7 ggplot Aesthetics (III): Global Aesthetic Mapping
So far, you have learned how to create scatterplots using geom_point(), line plots using geom_line(), and smoothline fits using geom_smooth(). It is sometimes useful to combine multiple geoms in the same plot.
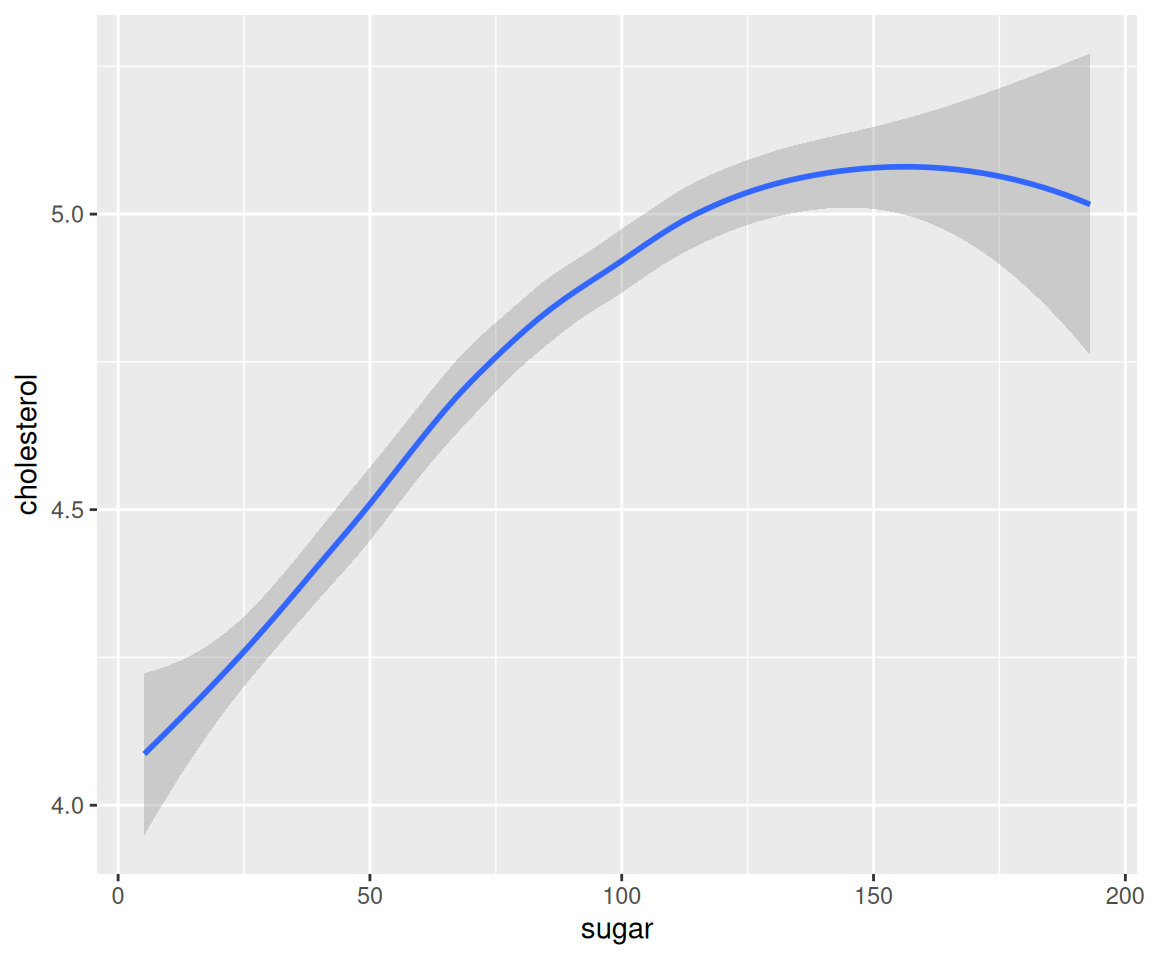
Let’s first review the scatterplot and smoothline fit between sugar and cholesterol.
library(r02pro)
library(tidyverse)
ggplot(data = gm2004) +
  geom_point(mapping = aes(x = sugar,
                           y = cholesterol))
6.7.1 Multiple geoms
To combine multiple geoms, you can simply use + to add them.
ggplot(data = gm2004) +
  geom_point(mapping = aes(x = sugar,
                           y = cholesterol)) +
  geom_smooth(mapping = aes(x = sugar,
                           y = cholesterol))
#> `geom_smooth()` using method = 'loess' and formula = 'y ~ x'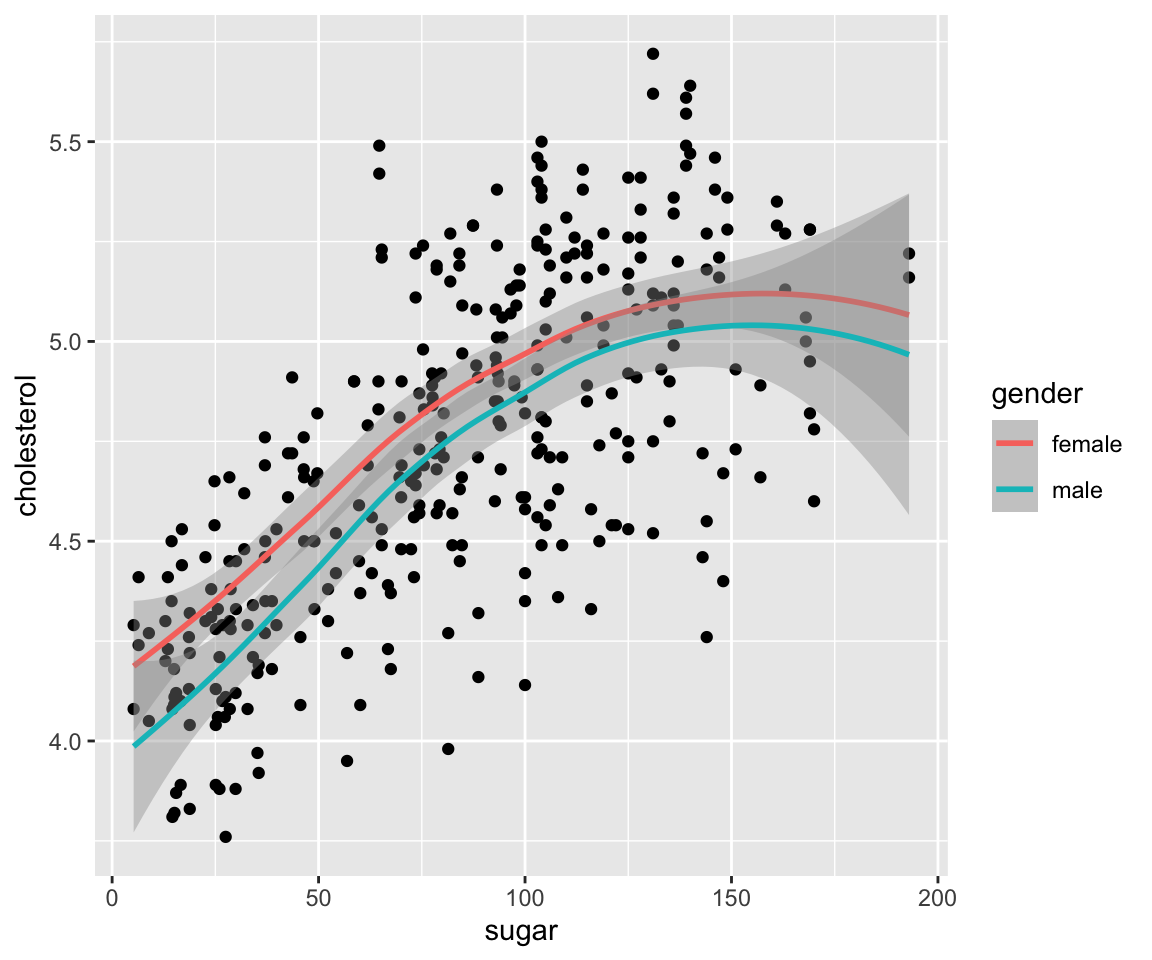
As expected, you see all the points and the smoothline fit on the same plot, which contains very rich information.
As usual, you can add aesthetics to both geoms.
Let’s first map gender to the color aesthetic for geom_smooth().
ggplot(data = gm2004) +
  geom_point(mapping = aes(x = sugar,
                           y = cholesterol)) +
  geom_smooth(mapping = aes(x = sugar,
                           y = cholesterol,
                           color = gender))
#> `geom_smooth()` using method = 'loess' and formula = 'y ~ x'
To verify the two smoothline fits are indeed fitted from the data points in the two groups, you can map gender to the color aesthetic for geom_point() as well. In addition, let’s also map population to the size aesthetic.
ggplot(data = gm2004) +
  geom_point(mapping = aes(x = sugar,
                           y = cholesterol,
                           color = gender,
                           size = population)) +
  geom_smooth(mapping = aes(x = sugar,
                           y = cholesterol,
                           color = gender))
#> `geom_smooth()` using method = 'loess' and formula = 'y ~ x'
The plot is reassuring that the two smoothline fits indeed correspond to the data points in the two groups defined by gender.
In addition to mapping variables to aesthetics, you can also add Constant-Valued aesthetics for each geom.
ggplot(data = gm2004) +
  geom_point(mapping = aes(x = sugar,
                           y = cholesterol,
                           color = gender,
                           size = population),
             shape = 2,
             alpha = 0.9) +
  geom_smooth(mapping = aes(x = sugar,
                           y = cholesterol,
                           color = gender),
              linetype = 2,
              se = FALSE)
#> `geom_smooth()` using method = 'loess' and formula = 'y ~ x'
Now, let’s see an example of combining the scatterplot with the line plot using the sahp dataset. Let’s focus on the houses that were sold before 2007.
sahp_2006 <- sahp[format(sahp$dt_sold, "%Y") < 2007, ] #all houses sold before 2007
ggplot(data = sahp_2006) +
  geom_line(mapping = aes(x = dt_sold,
                          y = sale_price))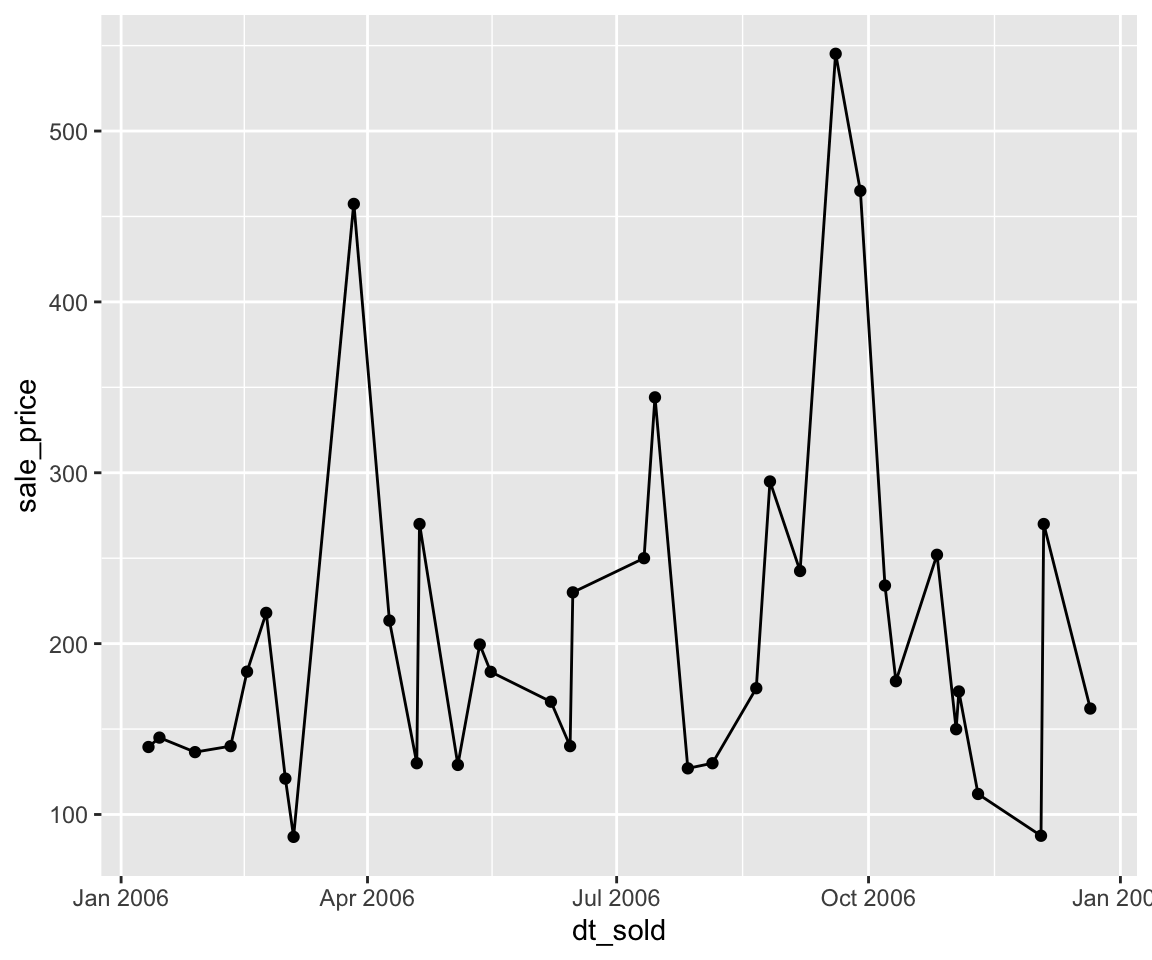
Next, we will add the line plot on top of the scatterplot.
ggplot(data = sahp_2006) +
  geom_line(mapping = aes(x = dt_sold,
                          y = sale_price)) +
  geom_point(mapping = aes(x = dt_sold,
                          y = sale_price))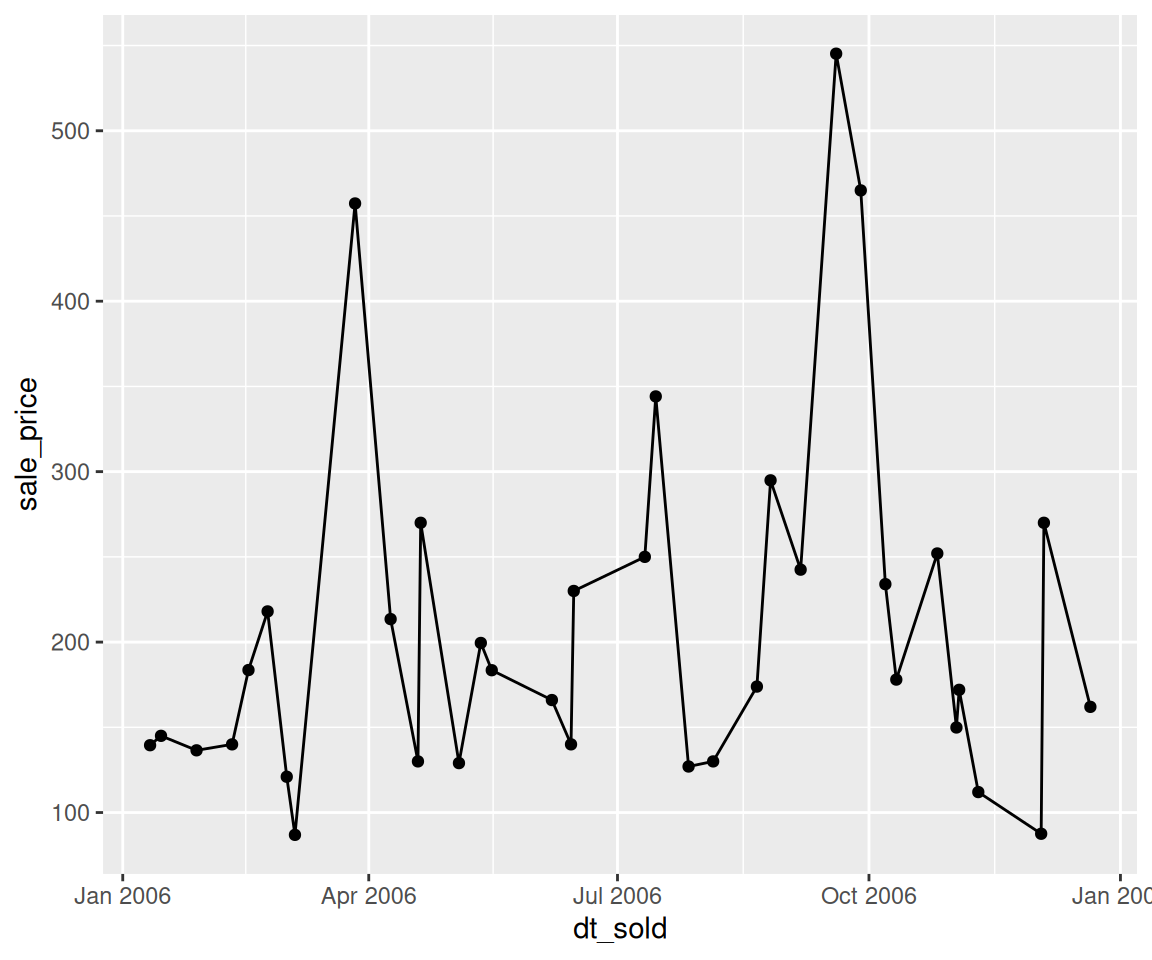
Clearly, having both the scatterplot and the line plot make the plot more informative.
6.7.2 Global Aesthetic Mapping
In Sections 6.2 and 6.3, we introduced the Constant-Valued Aesthetics and Local Aesthetic Mapping. Now, we are going to introduce the final way of specifying aesthetics, namely the Global Aesthetic Mapping. In contrast to the local aesthetic mapping where the mapping only works at the local level, the global aesthetic mapping will impact all the geoms considered in the entire ggplot.
Let’s take another look at the example where we have a scatterplot and a smoothline fit for the relationship between cholesterol and sugar.
ggplot(data = gm2004) +
  geom_point(mapping = aes(x = sugar,
                           y = cholesterol)) +
  geom_smooth(mapping = aes(x = sugar,
                           y = cholesterol))
You may notice that the arguments inside geom_point() and geom_smooth() are identical. The global aesthetic mapping allows us to simplify codes by specifying the mapping only once at the ggplot() level. Let’s take a look at how it works.
Clearly, this code is simpler to read and avoid repetition.
As another example, for the combination of scatterplot and line plot, we can also take advantage of the global aesthetic mapping.
Naturally, we can add additional aesthetic mappings to the aes() function.
ggplot(data = gm2004,
       mapping = aes(x = sugar,
                     y = cholesterol,
                     color = gender)) +
  geom_point() +
  geom_smooth()
#> `geom_smooth()` using method = 'loess' and formula = 'y ~ x'
6.7.2.1 Extend Global Aesthetic Mappings
In addition to the global aesthetic mappings, you can add additional local aesthetic mappings to each geom.
ggplot(data = gm2004,
       mapping = aes(x = sugar,
                     y = cholesterol,
                     color = gender)) +
  geom_point(mapping = aes(size = population)) +
  geom_smooth()
#> `geom_smooth()` using method = 'loess' and formula = 'y ~ x'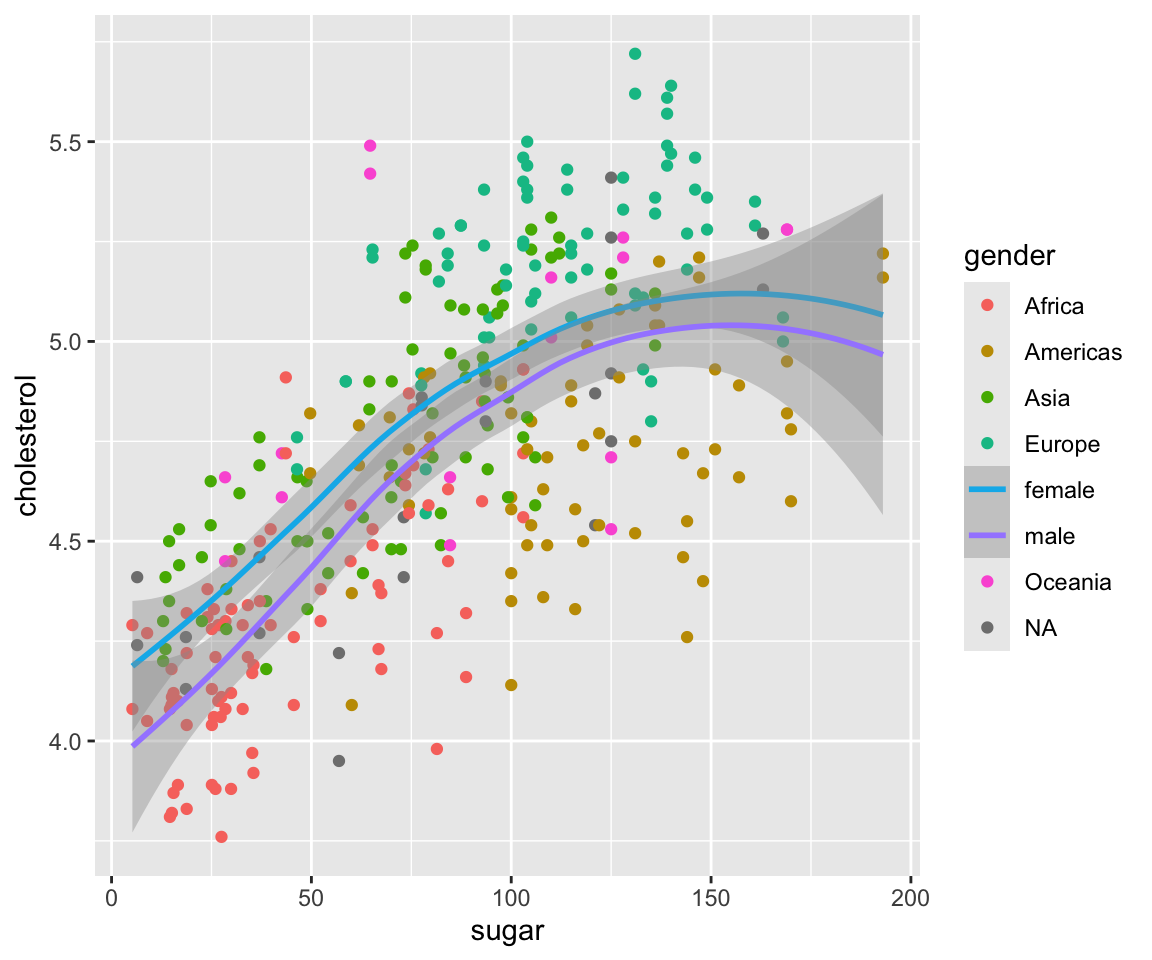
Here, the global aesthetic mapping x = sugar, y = cholesterol, and color = gender are passed to geom_point() and geom_smooth(). And we have an additional local aesthetic mapping size = population for geom_point().
6.7.2.2 Overwrite Global Aesthetic Mappings
When you add the same aesthetic mapping in the local geom as one of the global mappings, the corresponding global aesthetic mapping will be overwritten.
ggplot(data = gm2004,
       mapping = aes(x = sugar,
                     y = cholesterol,
                     color = gender)) +
  geom_point(mapping = aes(color = continent)) +
  geom_smooth()
#> `geom_smooth()` using method = 'loess' and formula = 'y ~ x'
Here, the global aesthetic mapping color = gender is first passed to both geom_point() and geom_smooth(). However, since there is a local aesthetic mapping for color (color = continent) in geom_point(), the local aesthetic mapping will overwrite the global one, resulting countries in different continents having different colors. Note that the legend may look a bit weird as it contains a mix of values for continent and gender under the name gender. This is an artifact of the ggplot implementation. As a result, it is recommended to avoid this kind of overwriting behavior.
6.7.2.3 No Global Constant-Valued Aesthetics
Let’s review the difference between the Constant-Valued Aesthetic and the Global Aesthetic Mapping.
- The constant-valued aesthetic sets the aesthetic value for all points/lines on the graph (for example,
color = redwill make all points red) for a single geom. It doesn’t interfere with the other geoms. - The global aesthetic mapping is an aesthetic mapping (for example,
color = genderwill use different colors for different gender values) that will be passed into all available geoms considered in the single plot.
It is worth noting that we can’t set the constant-valued aesthetic at the global level, i.e.there is no Global Constant-Valued Aesthetics. Let’s try to change all the points and lines to purple by adding color = "purple" in ggplot().
ggplot(data = gm2004,
       mapping = aes(x = sugar,
                     y = cholesterol),
       color = "purple") +
  geom_point() +
  geom_smooth()
#> `geom_smooth()` using method = 'loess' and formula = 'y ~ x'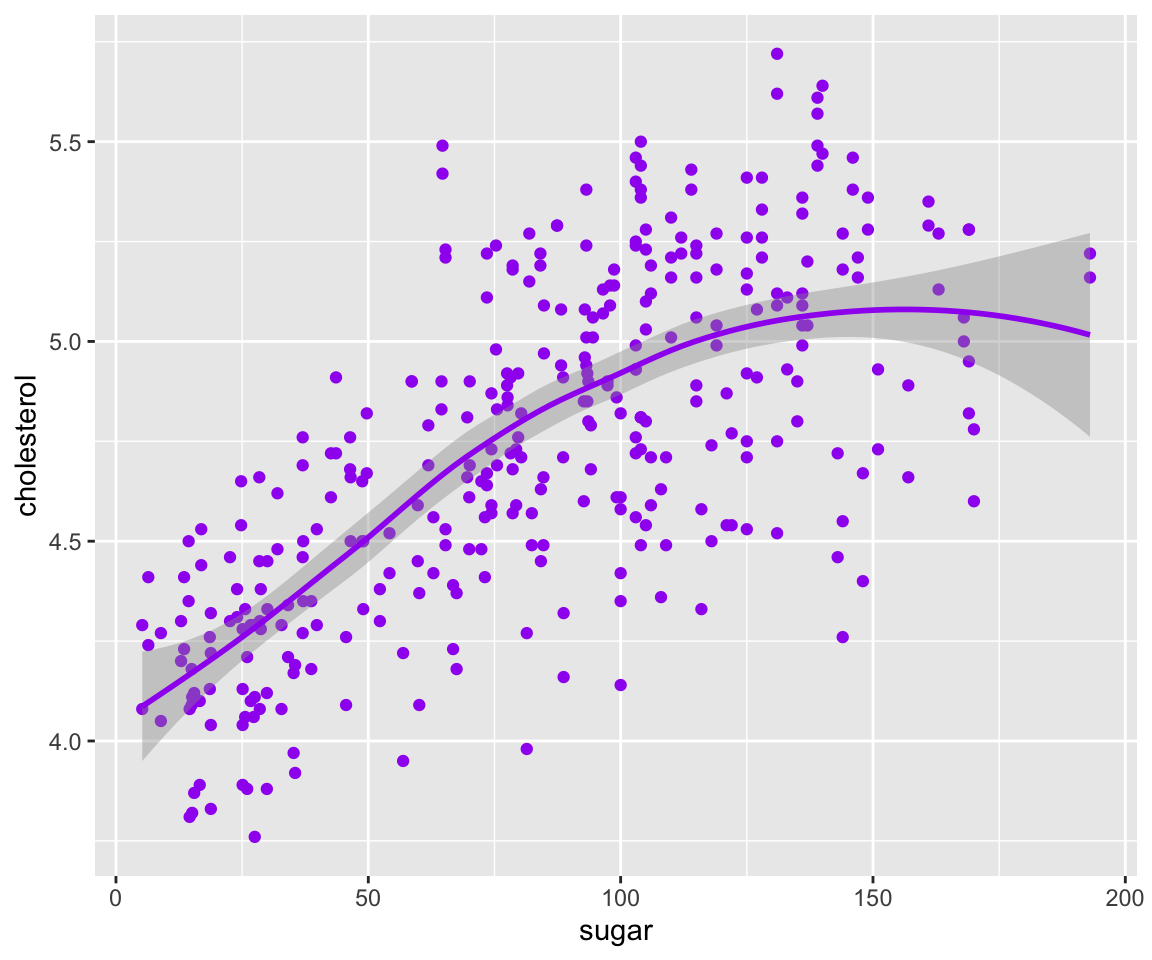
As you can see from the output, the argument color = "purple" was ignored during the plotting process. To achieve this, you need to use color = "purple" as constant-valued aesthetics for both geoms as below.
ggplot(data = gm2004,
       mapping = aes(x = sugar,
                     y = cholesterol)) +
  geom_point(color = "purple") +
  geom_smooth(color = "purple")
#> `geom_smooth()` using method = 'loess' and formula = 'y ~ x'
6.7.2.4 Mixing the three types of aesthetics
Now, let’s see an example where all three types of aesthetics are used.
ggplot(data = gm2004,
       mapping = aes(x = sugar,
                     y = cholesterol)) +
  geom_point(mapping = aes(size = population),
             color = "magenta") +
  geom_smooth(mapping = aes(color = gender),
              se = FALSE)
#> `geom_smooth()` using method = 'loess' and formula = 'y ~ x'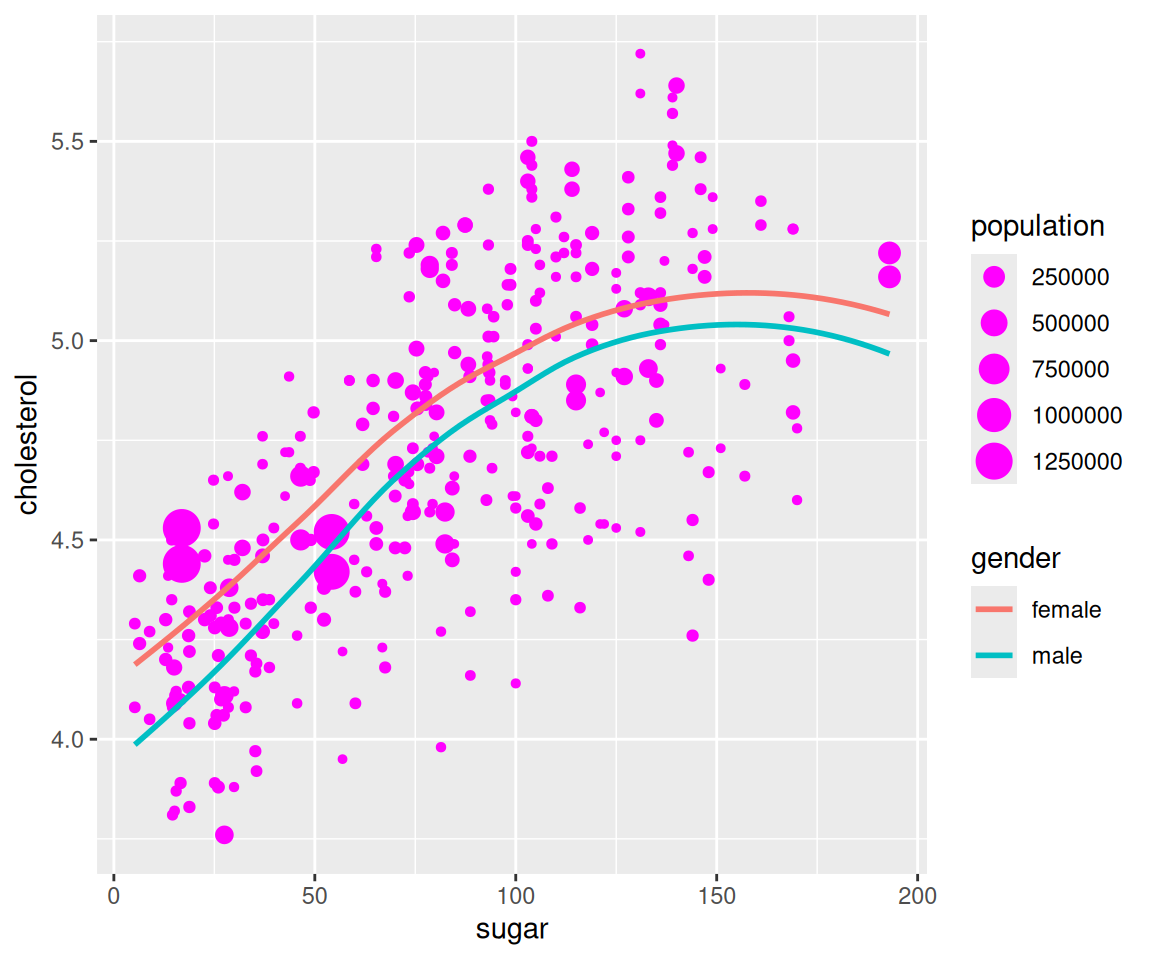
6.7.3 Exercises
Using the sahp dataset in the r02pro package, using the ggplot2 package to answer the following questions.
- With
lot_areaon the x-axis andsale_priceon the y-axis, create a plot that contains both the scatterplot and smoothline fits, where we use different colors in the scatterplot to distinguish whetherheat_qualis excellent and different linetypes for the smoothline fits depending on whetherhouse_styleis 2Story. - Create a plot of
liv_area(on the x-axis) andsale_price(on the y-axis) that contains both the scatterplot and the smoothline fit. - In the plot from Q2, using different colors for both the scatterplot and the smoothline fit to distinguish whether the house has more than 3 bedrooms and make all points to be size 2.
- If you run the following code
ggplot(data = sahp,
       mapping = aes(x = liv_area,
                     y = sale_price),
       color = "green") +
  geom_point() +
  geom_smooth()
Do you think all the points and the smoothline will be green? If not, explain the reason and make them green.
- Run
ggplot(data = sahp,
       mapping = aes(x = liv_area,
                     y = sale_price,
                     color = house_style)) +
  geom_point(mapping = aes(color = bedroom > 3)) +
  geom_smooth(mapping = aes(color = bedroom > 3))
Explain why you only see two colors in the plot although the house_style is mapped to color?
