7.2 Violin Plots
In this section, we introduce how to combine music with R via creating violin plots. In fact, the violin plot elegantly combines density plot (Section 6.10) and boxplot (Section 6.11) and into a single plot.
7.2.1 The basic violin plot
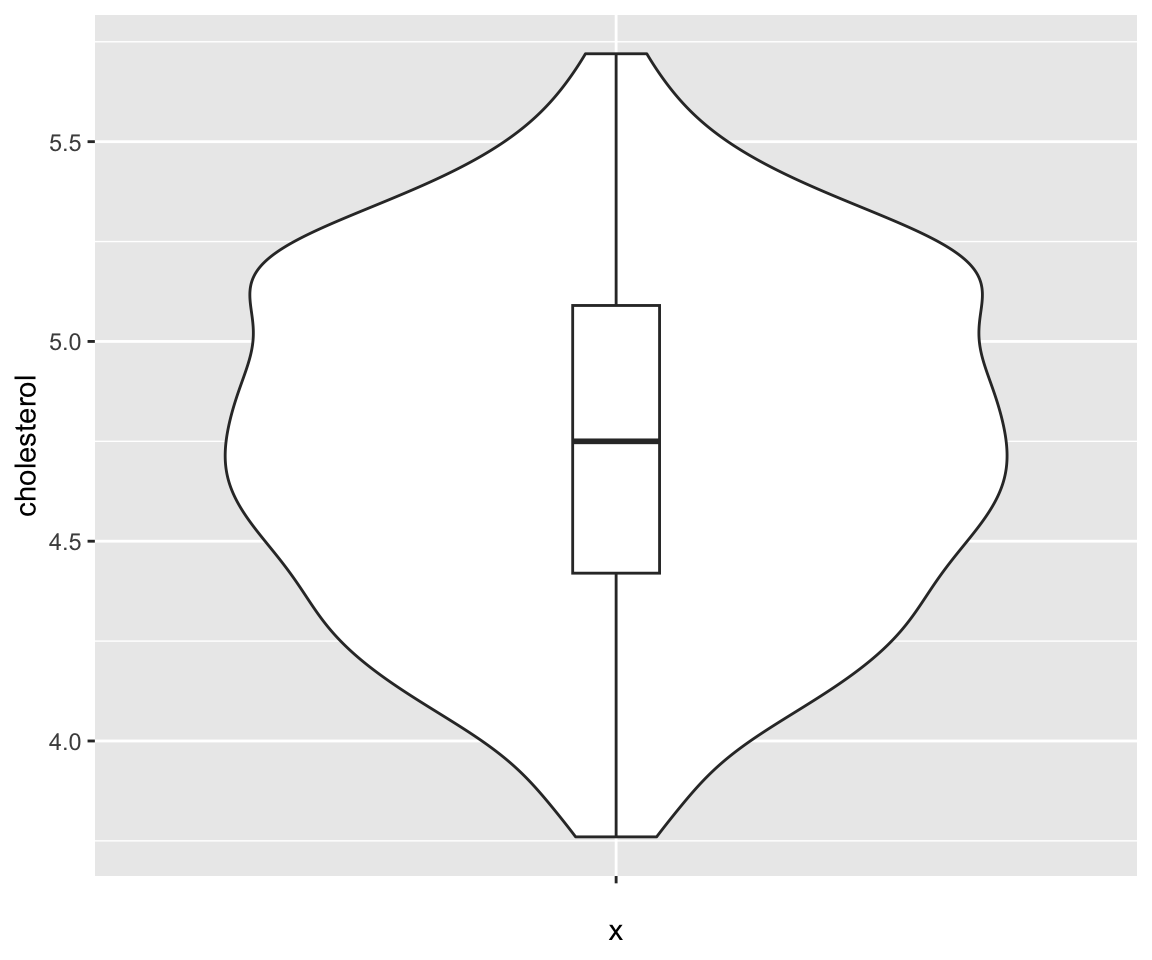
Let’s say we want to generate a basic violin plot for the variable cholesterol in the gm2004 dataset.
library(r02pro)
library(ggplot2)
ggplot(data = gm2004,
       aes(x = "", y = cholesterol)) +
  geom_violin()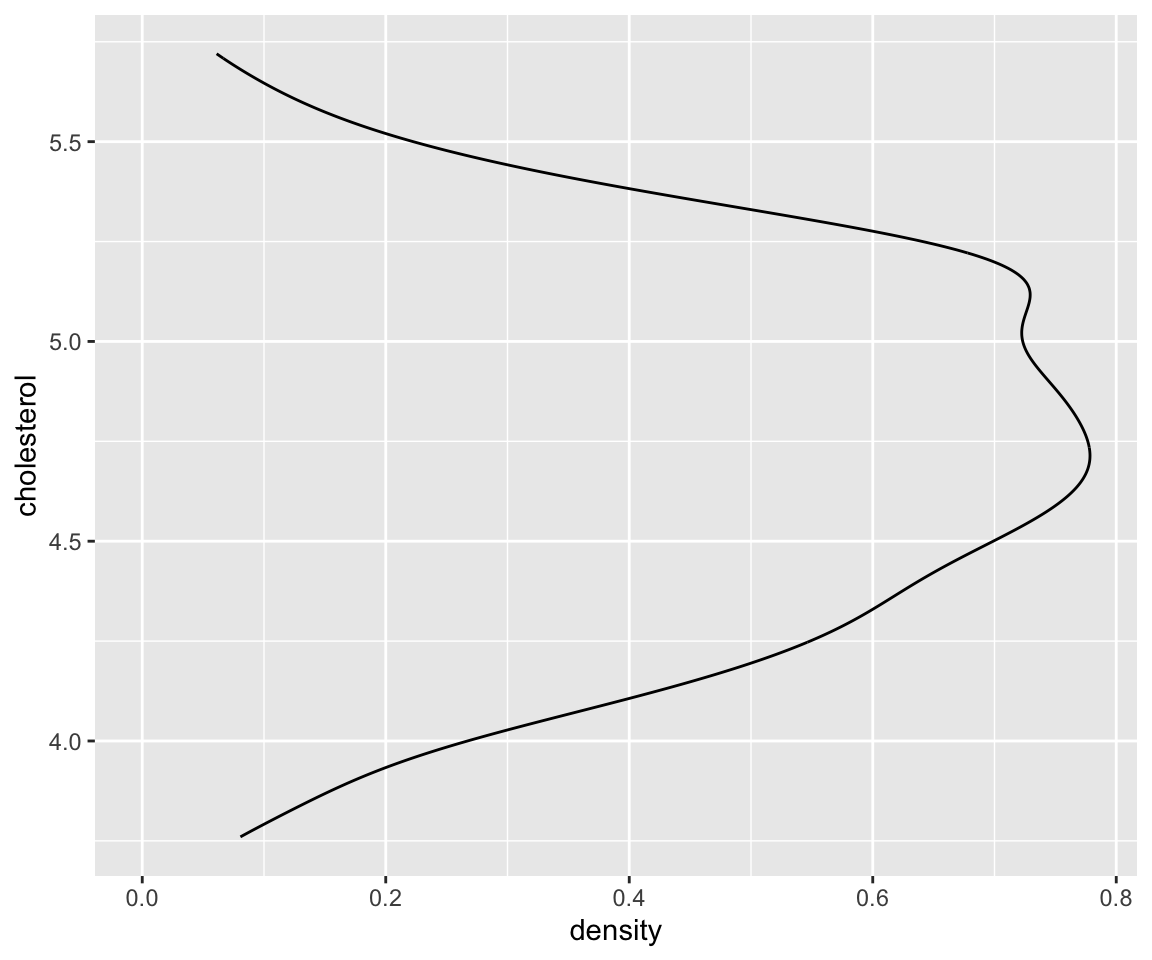
To introduce the detail of the generation process of violin plot, it is helpful to review the density plot.
Looking at these two plots, it is easy to see that the basic violin plot is nothing but a Mirrored Density Plot with the kernel density estimates on each side.
7.2.2 Violin plot with boxplot
Usually, the violin plot includes the boxplot inside it, providing extra information about the data. To do this, we just add the boxplot layer on top of the violin plot.
Here, we set the aesthetic width = 0.1 in the boxplot to make it thinner.
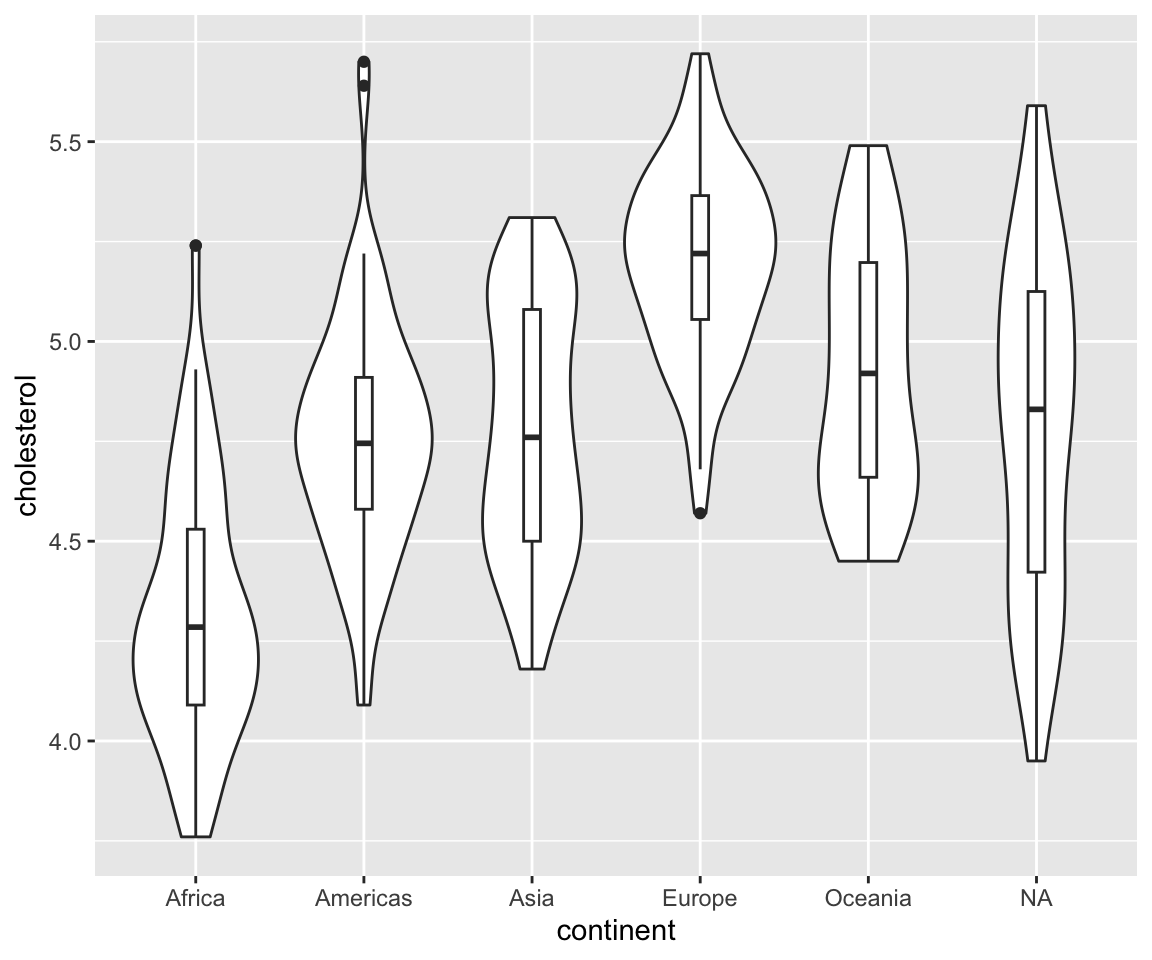
Just like in the boxplot, we can compare the distributions of a continuous variable for different values of a discrete variable. We can achieve this by mapping the discrete variable to the x axis.
ggplot(data = gm2004,
       aes(x = continent,
           y = cholesterol)) +
  geom_violin() +
  geom_boxplot(width = 0.1)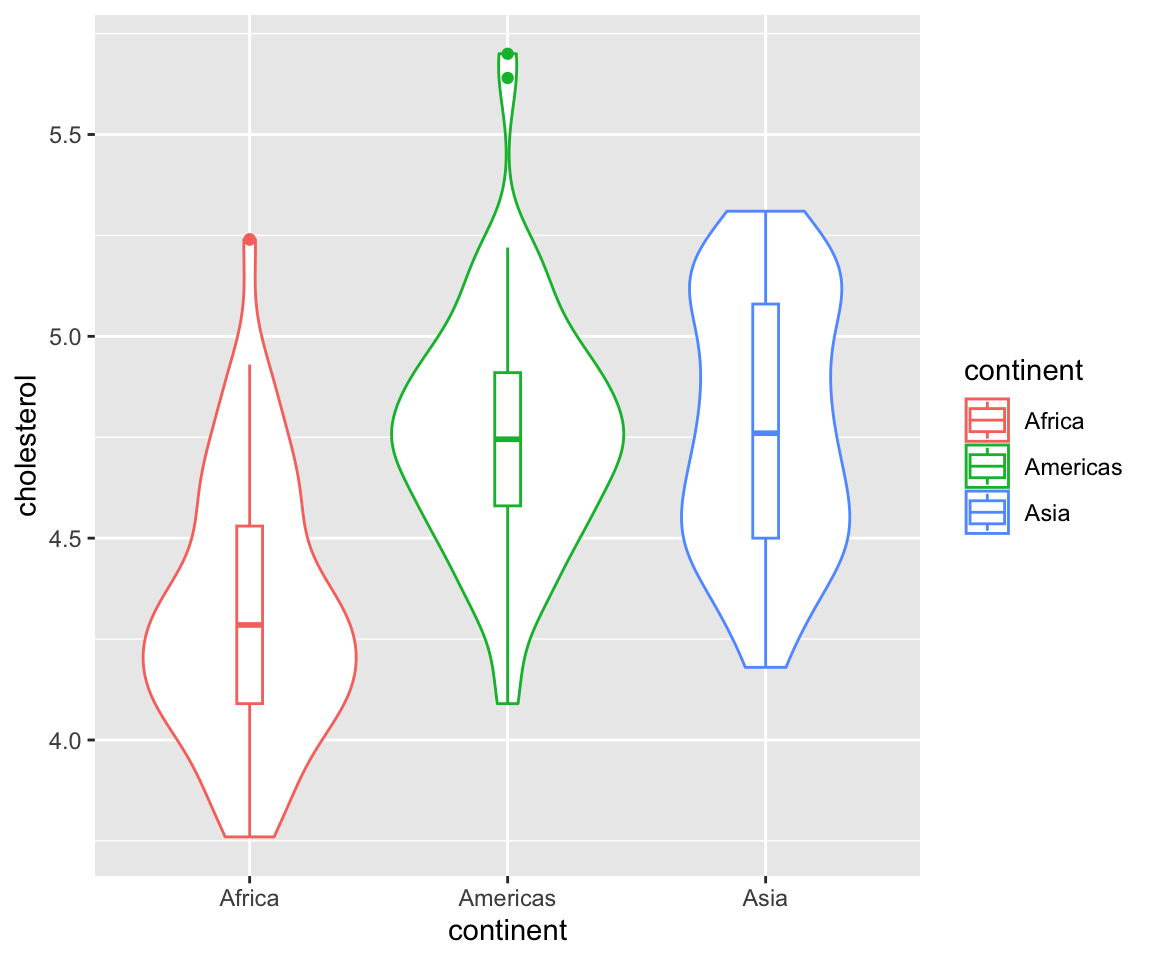
We can restrict the x-axis to a subset of the possible continent values.
ggplot(data = gm2004,
       aes(x = continent,
           y = cholesterol,
           color = continent)) +
  geom_violin() +
  geom_boxplot(width = 0.1) +
  scale_x_discrete(limits=c("Africa", "Americas", "Asia"))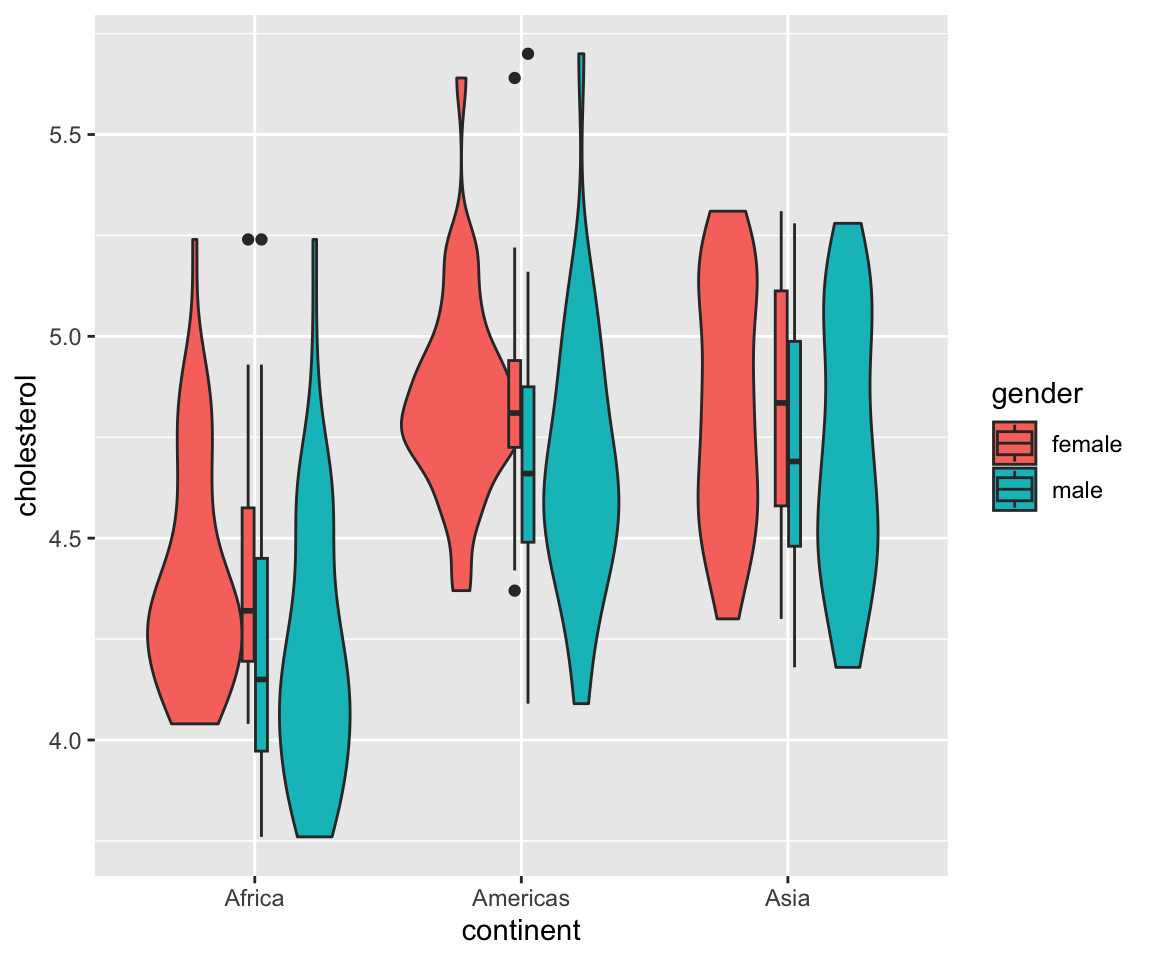
Similarly, we can map a third variable to an aesthetic.
ggplot(data = gm2004,
       aes(x = continent,
           y = cholesterol,
           fill = gender)) +
  geom_violin() +
  geom_boxplot(width = 0.1) +
  scale_x_discrete(limits=c("Africa", "Americas", "Asia"))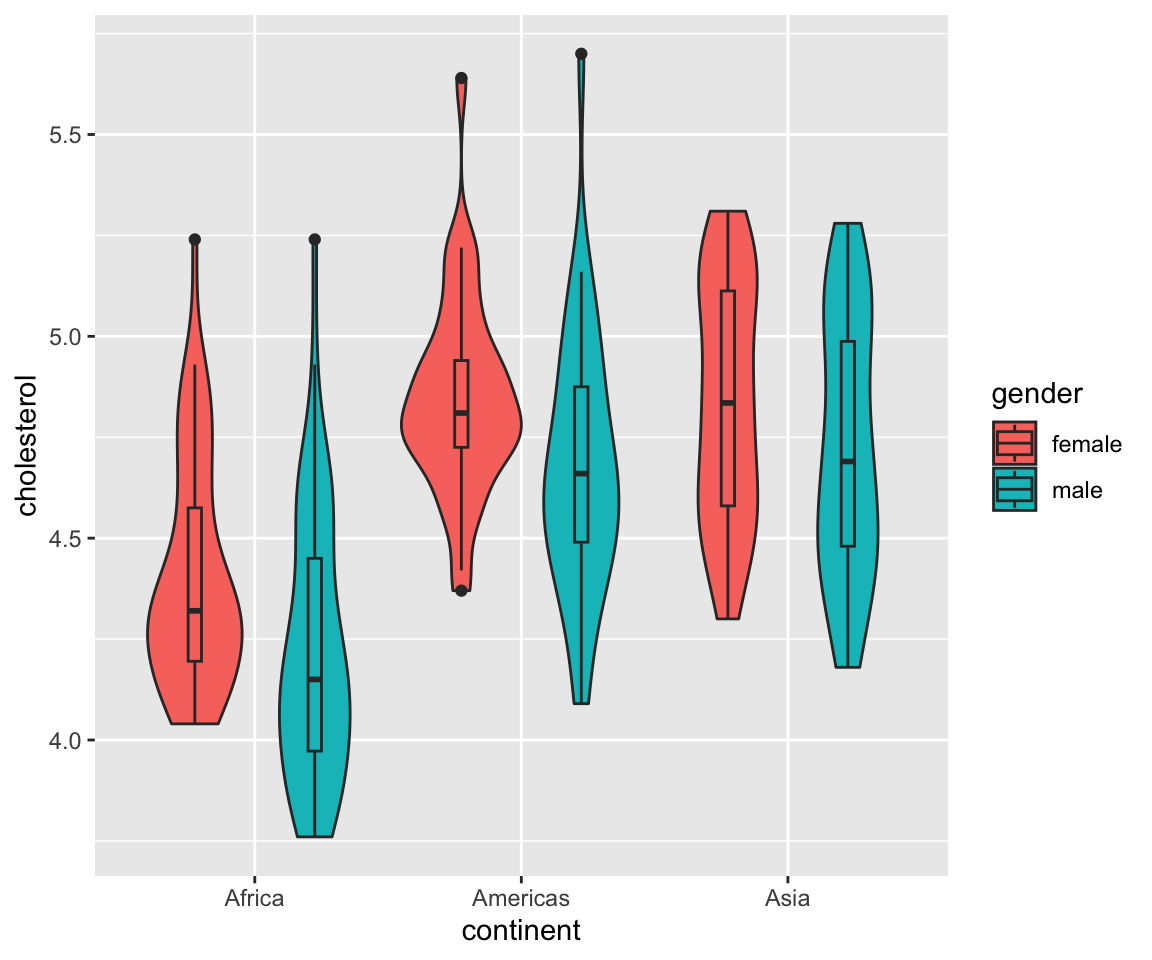
As you can see, the boxplot doesn’t align well inside the violin plot. To fix this issue, you can add the global aesthetic position = position_dodge(0.9) to both geoms.
ggplot(data = gm2004,
       aes(x = continent,
           y = cholesterol,
           fill = gender)) +
  geom_violin(position = position_dodge(0.9)) +
  geom_boxplot(width = 0.1, position = position_dodge(0.9)) +
  scale_x_discrete(limits=c("Africa", "Americas", "Asia"))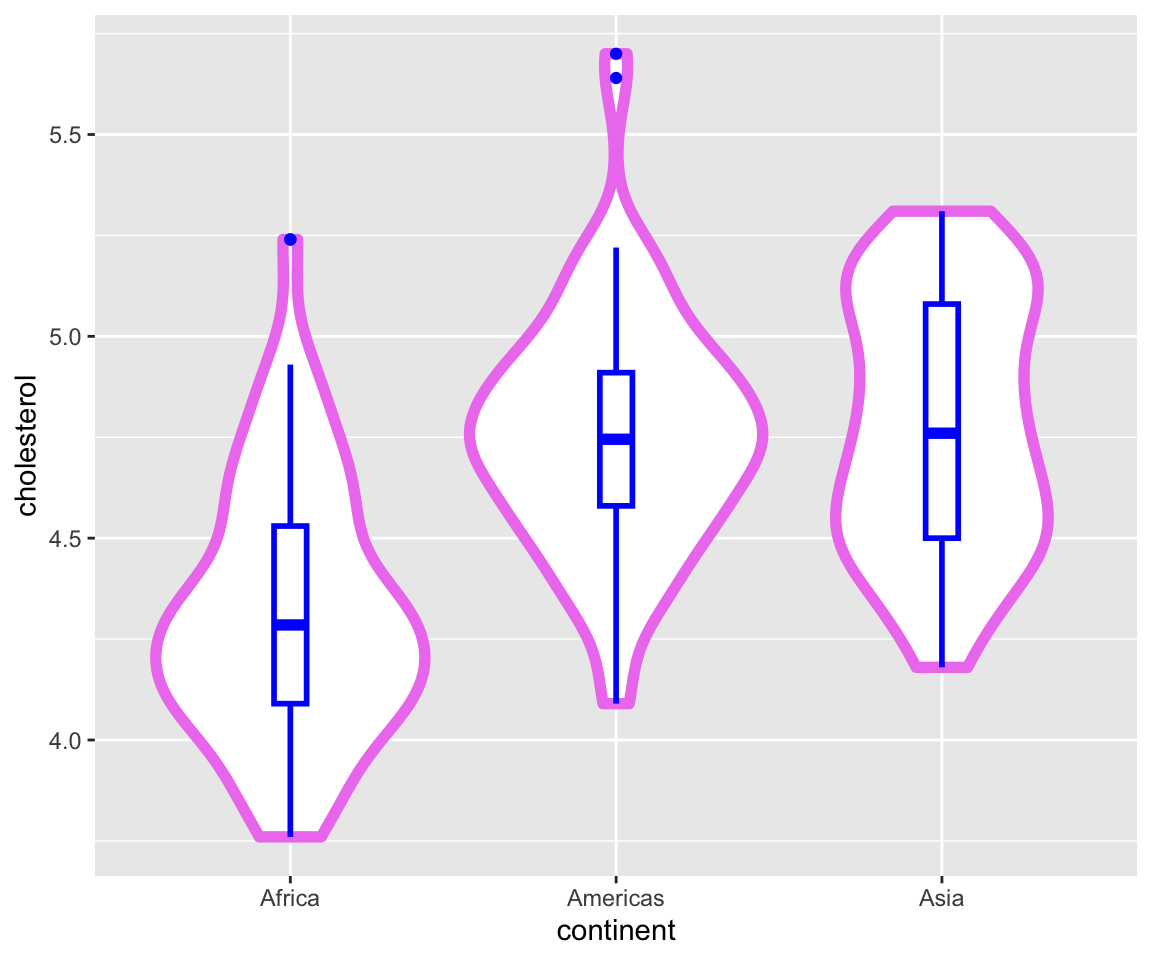
You can also try to add other Constant-Valued Aesthetics to both geoms to change their appearances.
ggplot(data = gm2004,
       aes(x = continent,
           y = cholesterol,
           color = continent)) +
  geom_violin(color = "violet",
              size = 2) +
  geom_boxplot(width = 0.1,
               color = "blue",
               size = 1) +
  scale_x_discrete(limits=c("Africa", "Americas", "Asia"))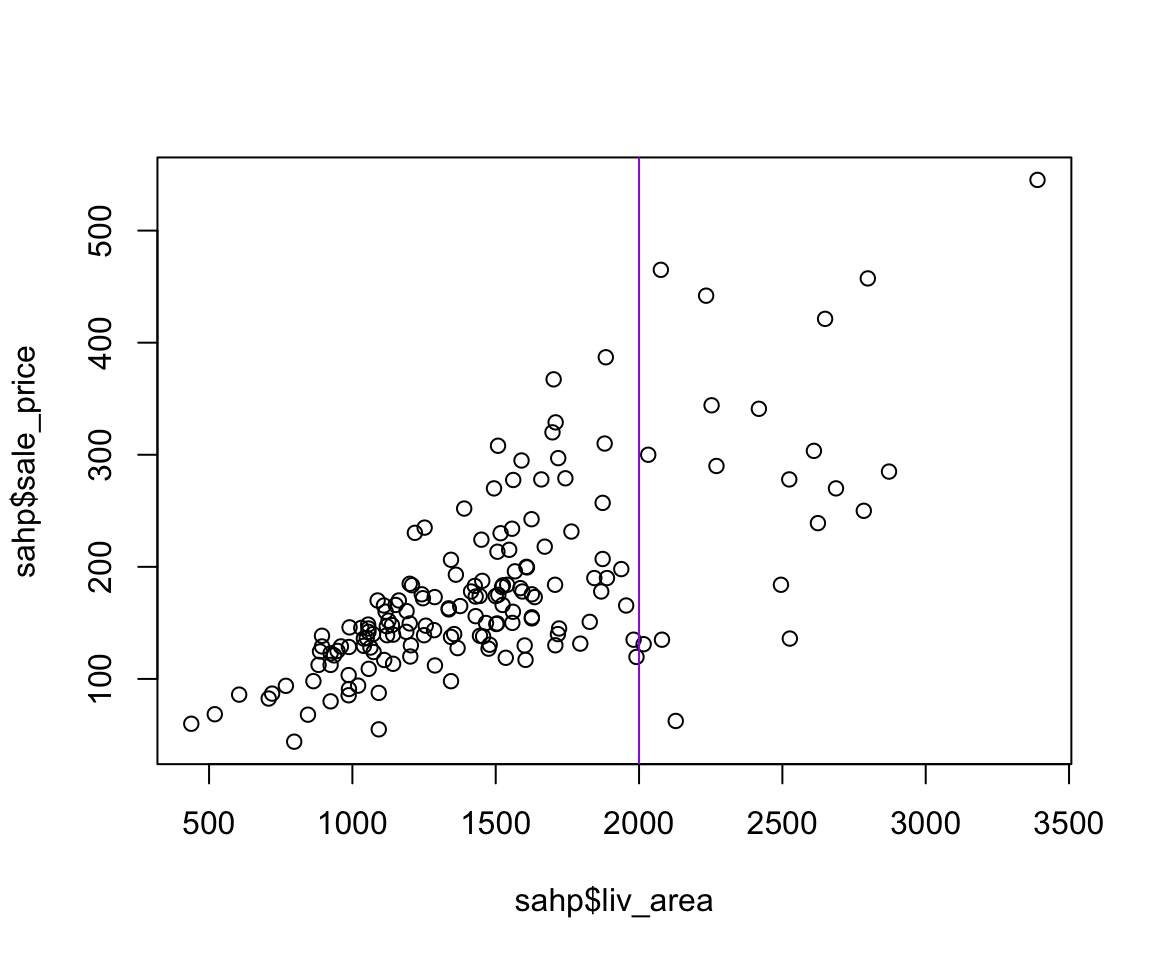
In this section, we introduced the violin plot, which combines the density plot and boxplot into a single visualization. By layering geom_violin() and geom_boxplot(), you can simultaneously see the distribution shape and summary statistics. When comparing groups with a third variable, remember to use position = position_dodge(0.9) to properly align the plots.
7.2.3 Exercises
Using the
sahpdataset from the r02pro package, create a violin plot forsale_pricegrouped byhouse_style, restricting to"1Story"and"2Story". Add a boxplot inside withwidth = 0.1.Using the
gm2004dataset, create a violin plot forBMIgrouped bycontinent. Mapcontinentto thefillaesthetic and add a boxplot inside withwidth = 0.1andposition = position_dodge(0.9).Modify your plot from Exercise 2 to only include
"Europe"and"Asia", and further group bygenderusing thefillaesthetic. Make sure both the violin and boxplot useposition = position_dodge(0.9).Create a violin plot for
cholesterolin thegm2004dataset. Customize the violin withcolor = "darkgreen"andsize = 1.5, and add a boxplot withcolor = "red"andwidth = 0.1.
